9.1 Network Dashboard
Label Colors
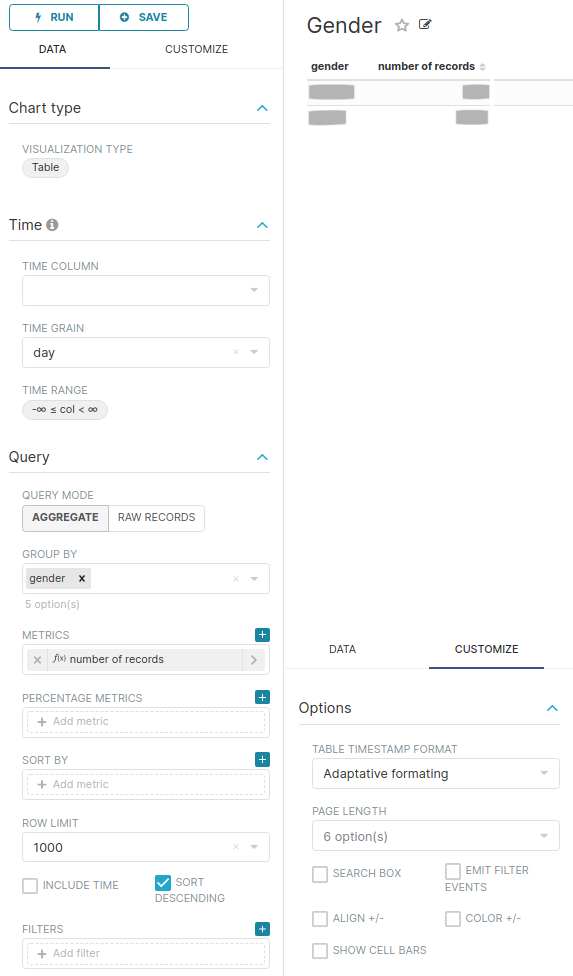
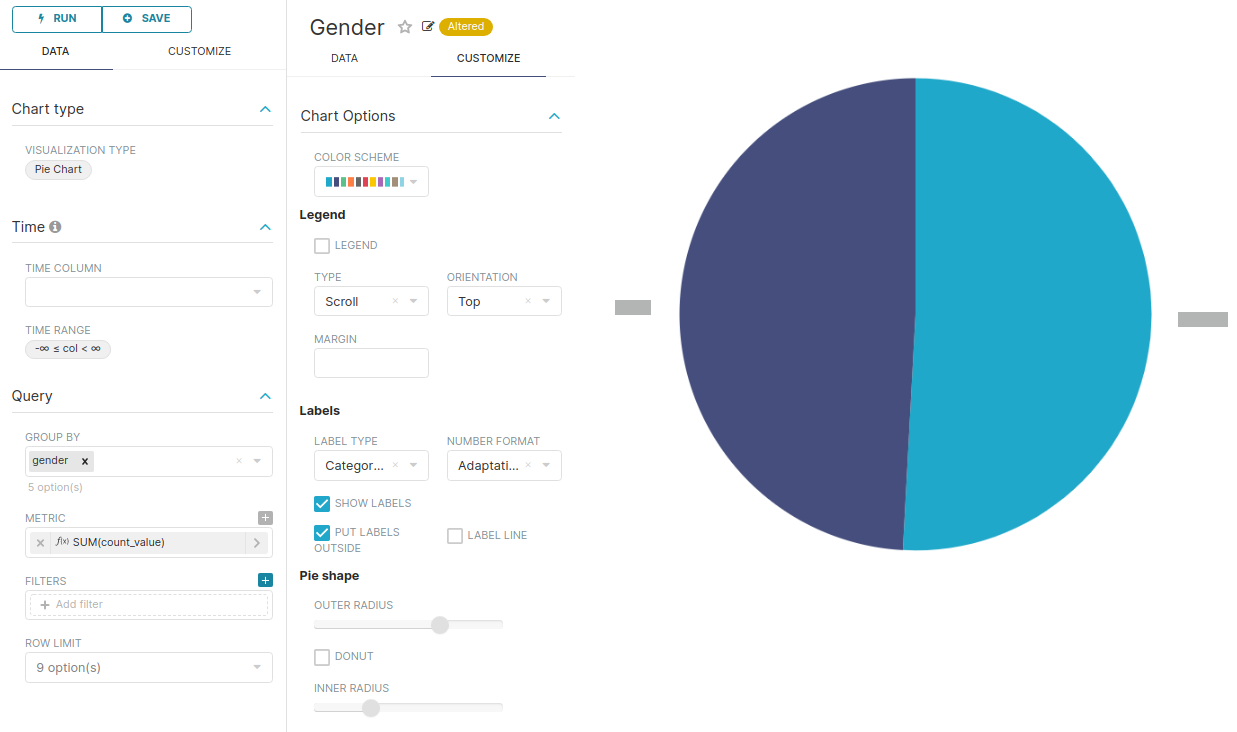
In order to obtain the colors blue and rose in the chart representing the gender distribution,
add the following JSON entry to the JSON object of the JSON Metadata field on the edit dashboard page:
"label_colors": {
    "Male": "#3366FF",
    "Female": "#FF3399"
}
CSS
Whenever a user types some texts on superset’s filters the avaiable options on it are filtered. Whenever no option matches the text inserted a ‘Create option “[inserted text]”’. Since Superset filters do exact match, this option will for sure return no results. Because of that, this option is being hidden with the following CSS:
.css-0.Select__option {
  display: none;
}
With this every time you want to edit the dashboard layout you have to either comment the CSS inserted or remove it so the “Edit Dashboard” button can show again.
Filters
Mappings
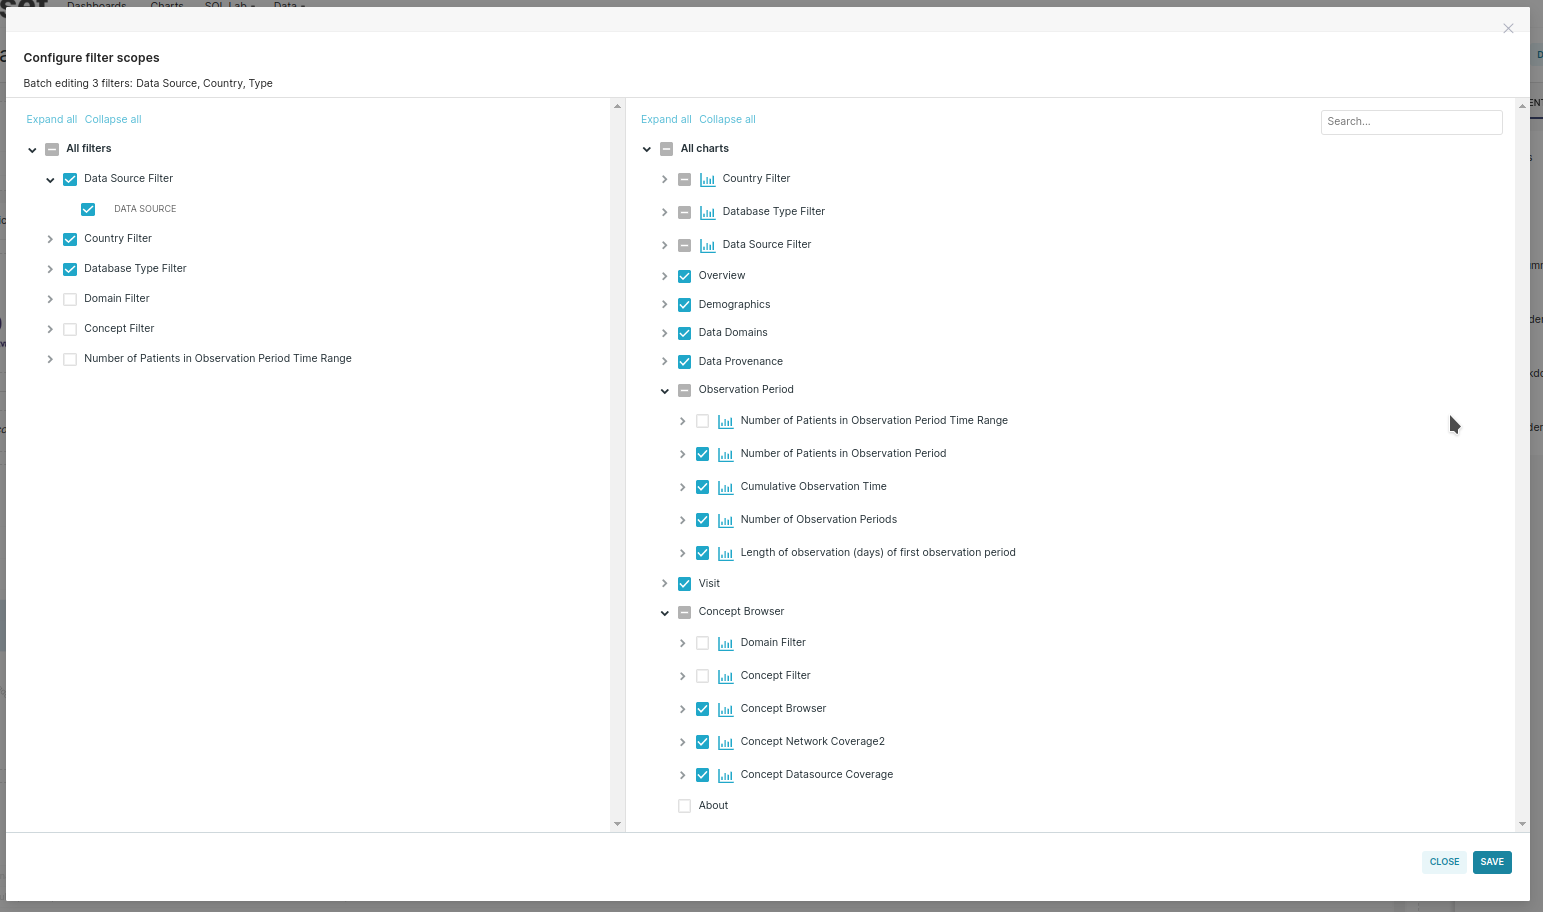
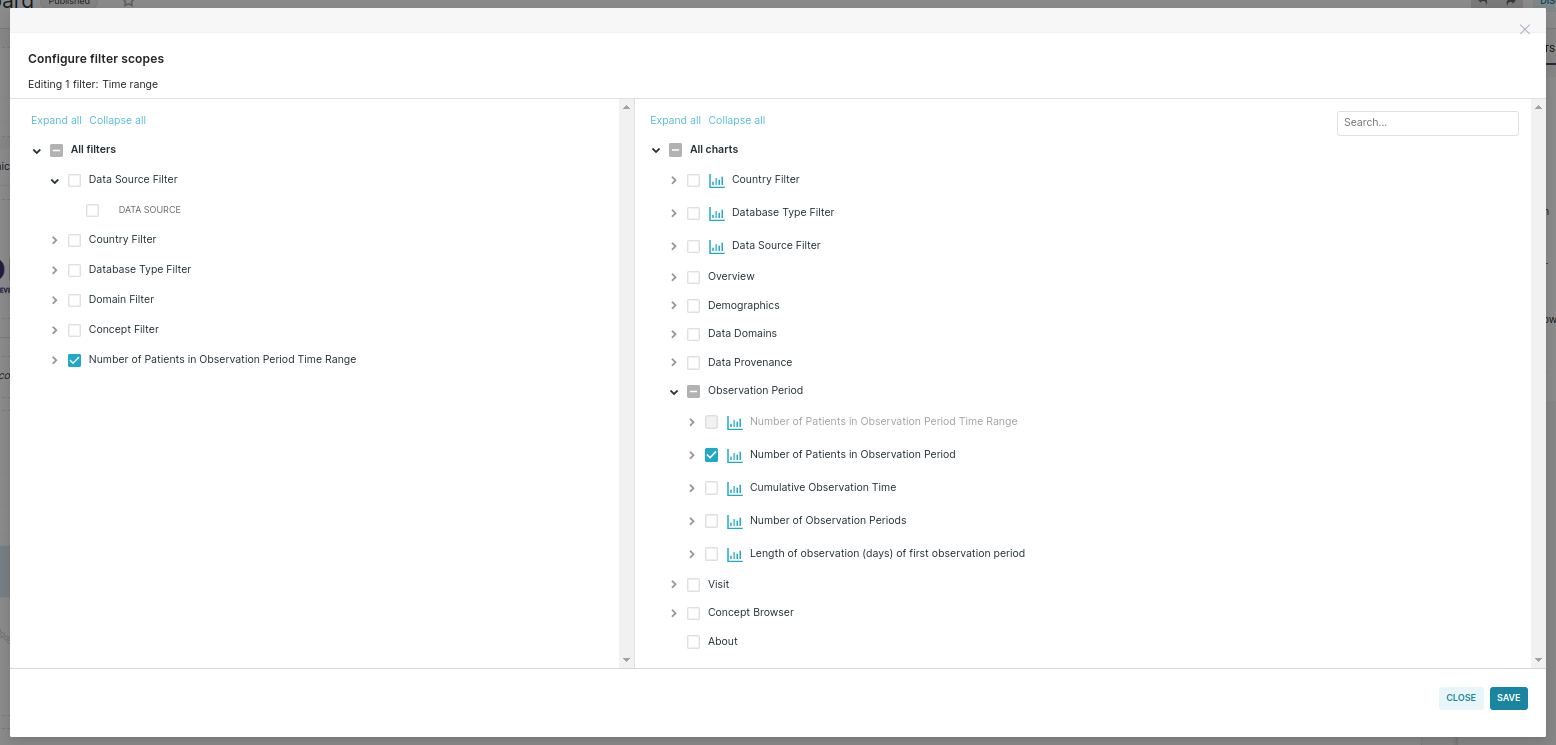
This defines which charts specific filters will affect. This can be edited by entering in edit mode, click the three dots near the “Save” and then go to “Set filter mappings”. To apply a mapping you have to select a set of filters on the left, choose on the right which charts it affects and finally hit save. You have to do this procedure for the different sets of filters that have different mappings.
This is done mainly to not confuse the user. Let’s say you choose “Portugal” on the country filter and that databases from Portugal only have records of the Dug domain. After this, if the user clicks on the domain filter dropdown, only the Drug domain option will appear. With this, the user might get the idea that the system only has records of the Drug domain. If all options appear on the domain filter, the charts will show “No results” and with this, the users should conclude that for the set of filters defined there is no data.
Global filters: note that it does not affect the other filters mentioned below.
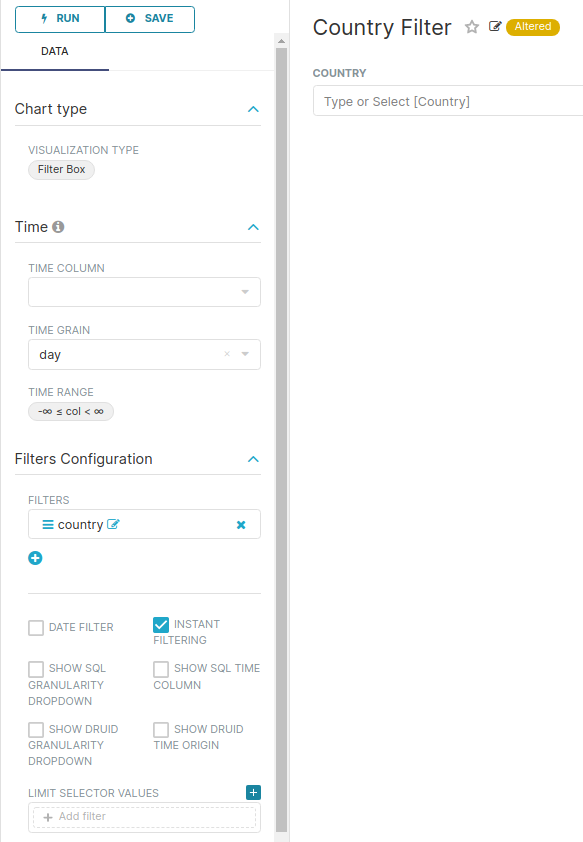
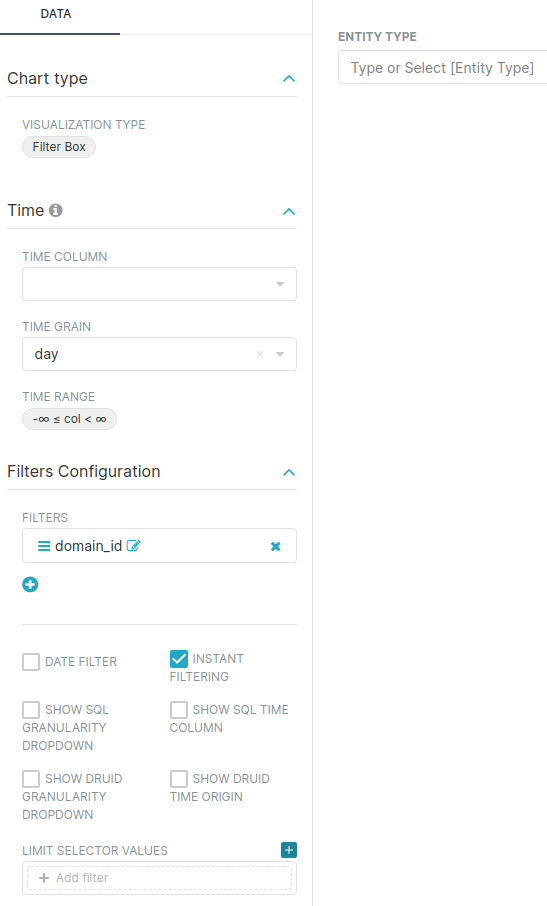
Domain Filter
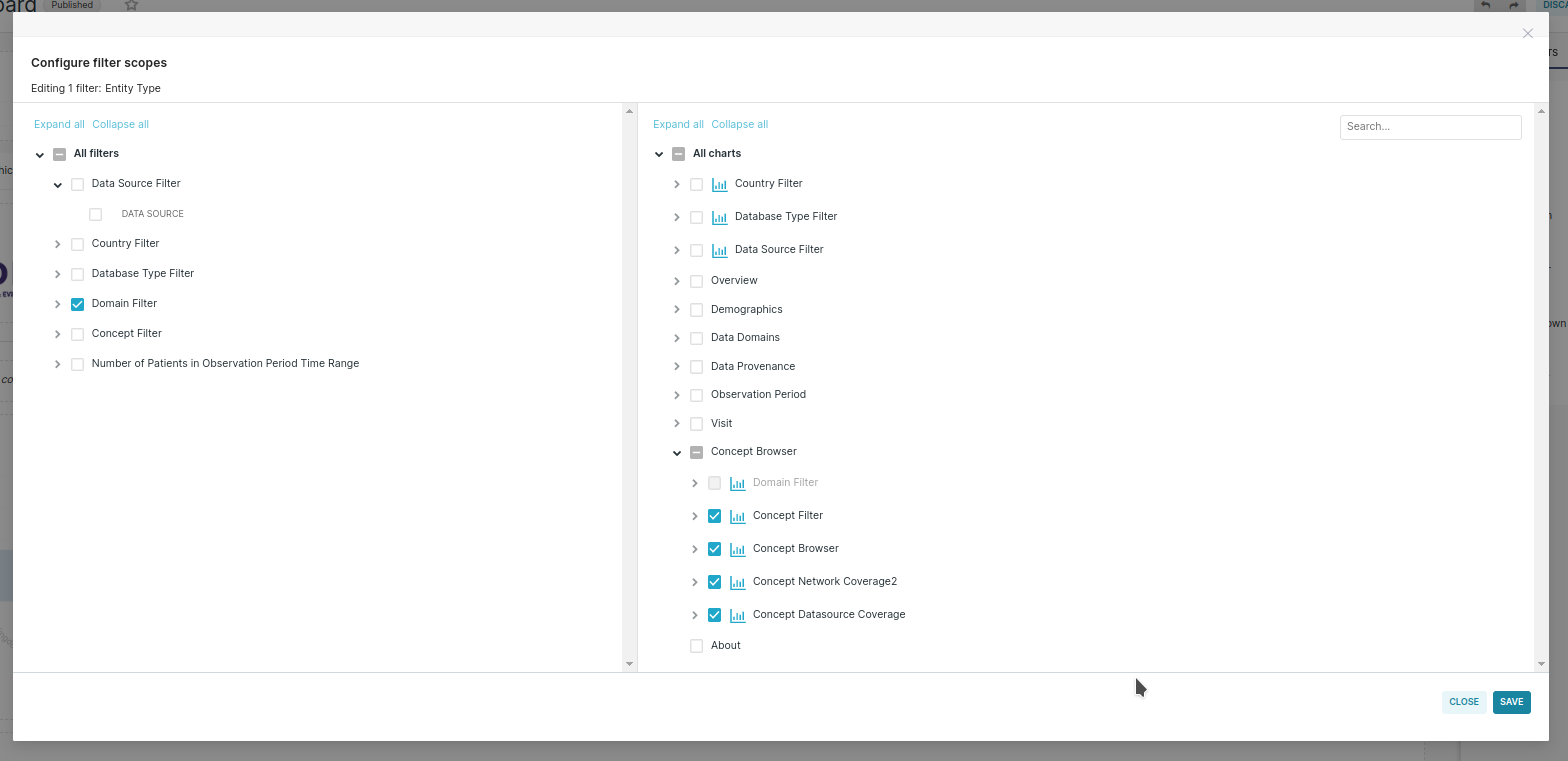
Concept Filter: Note that it does not affect the Domain filter
Number of patitents in observation period time range
Overview Tab
Demographics Tab
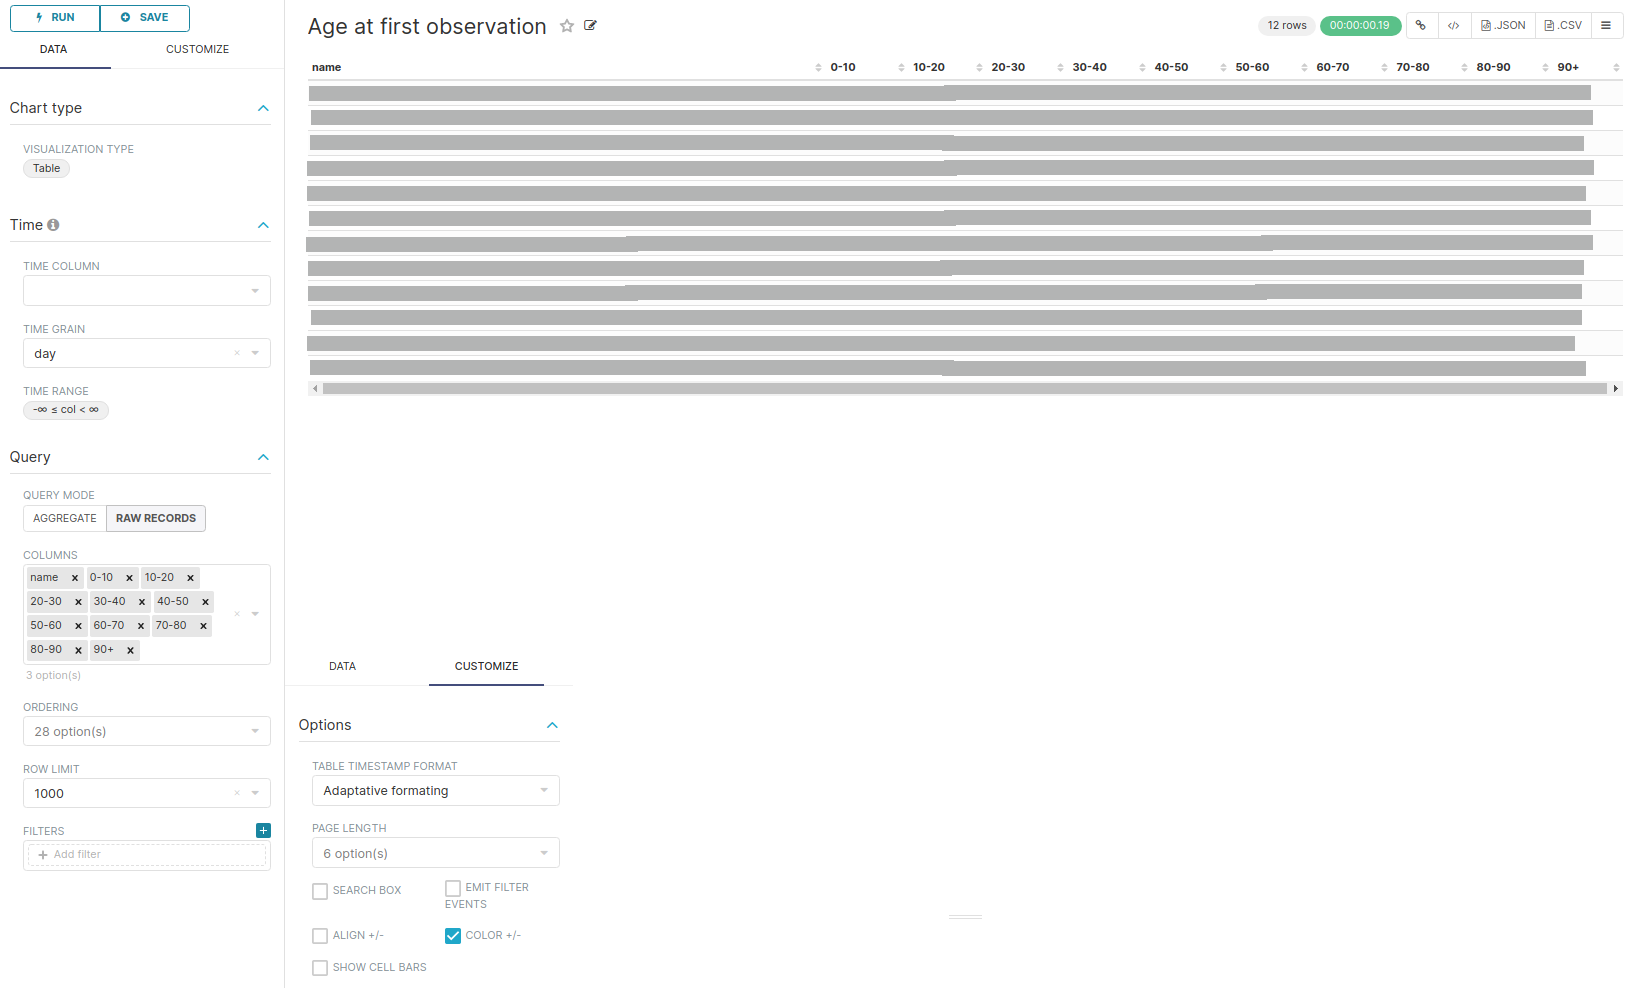
Distribution of age at first observation period
Dataset: Materialized View distribution_of_age_at_first_observation_period
Data Domains Tab
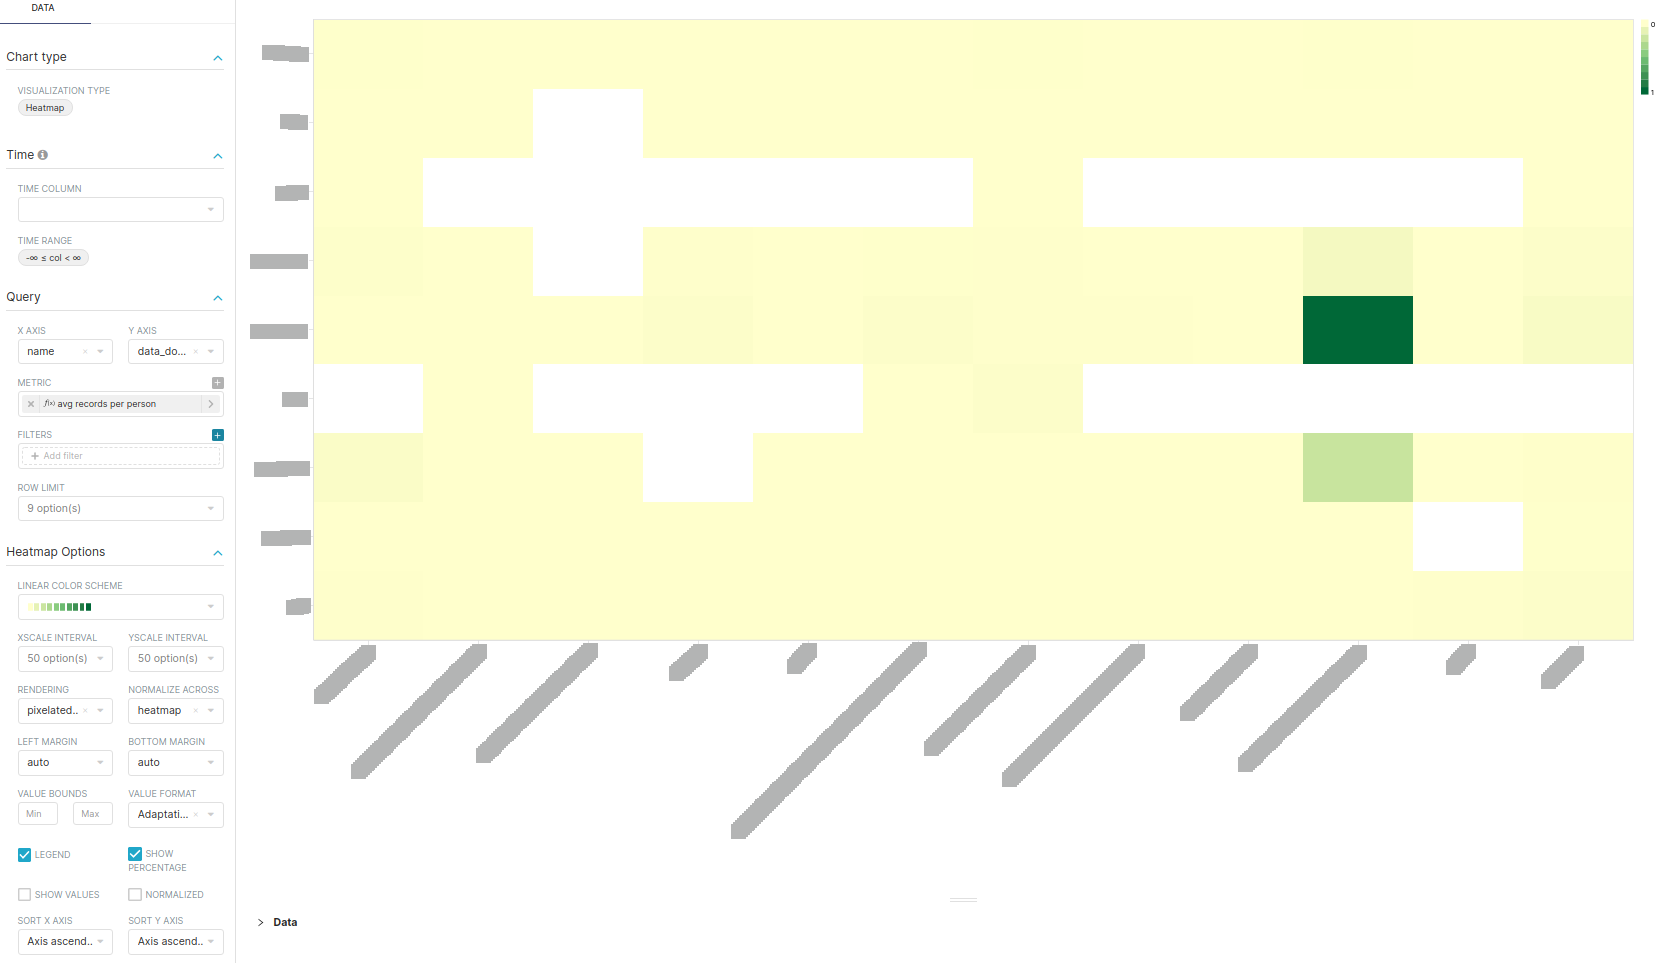
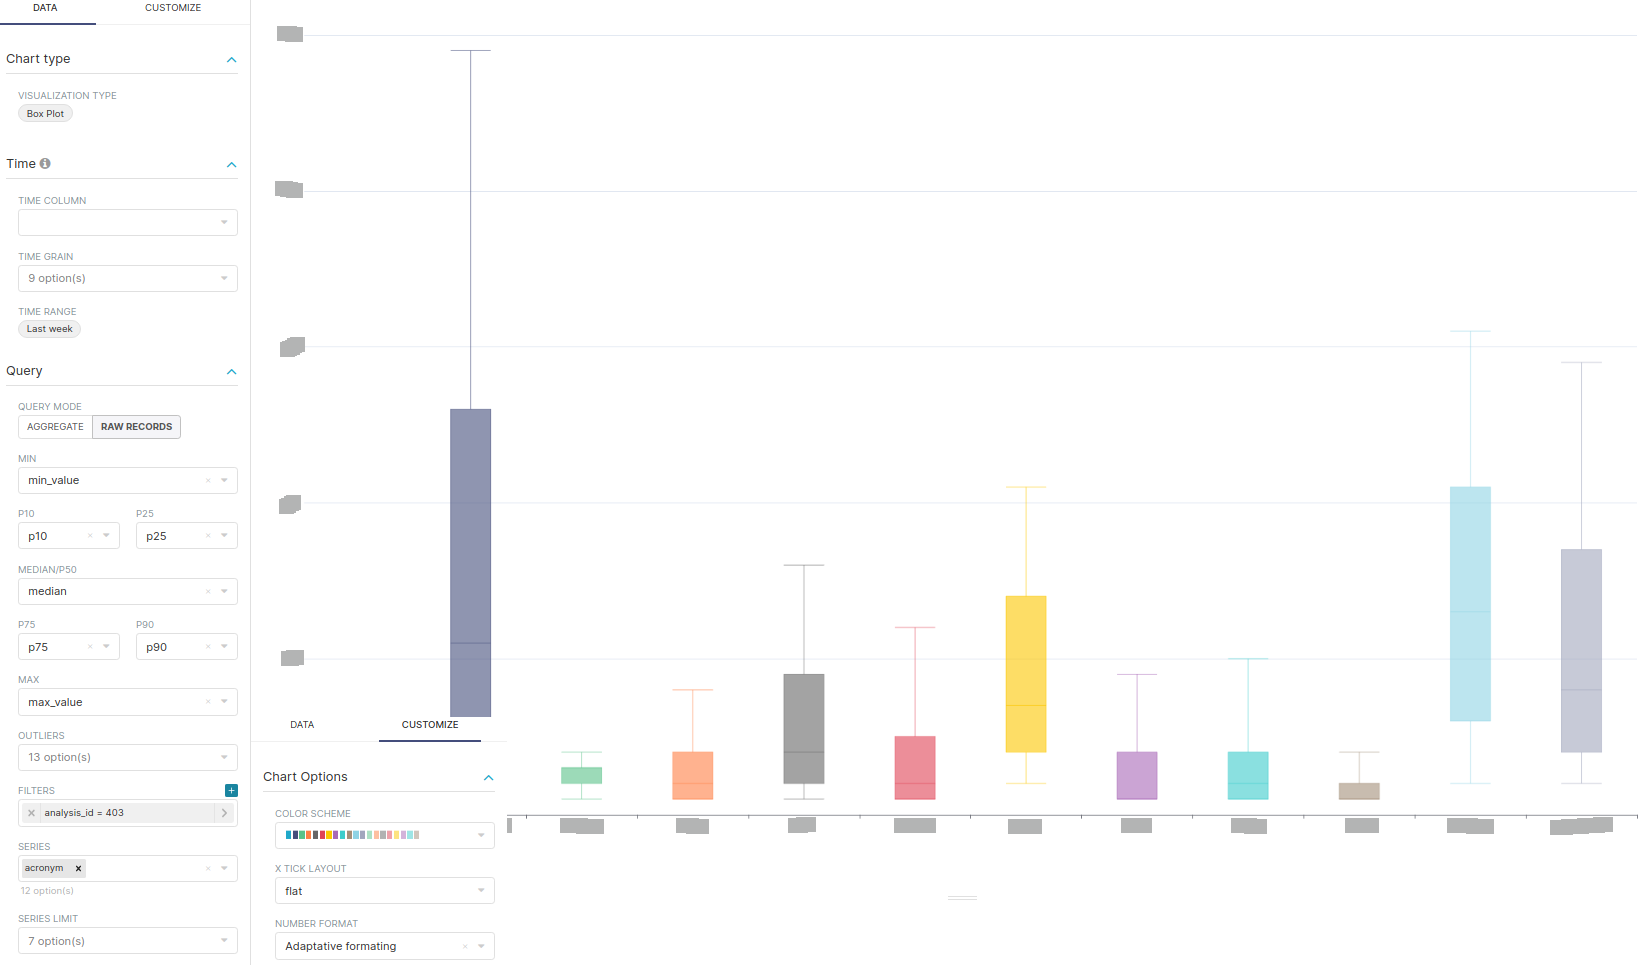
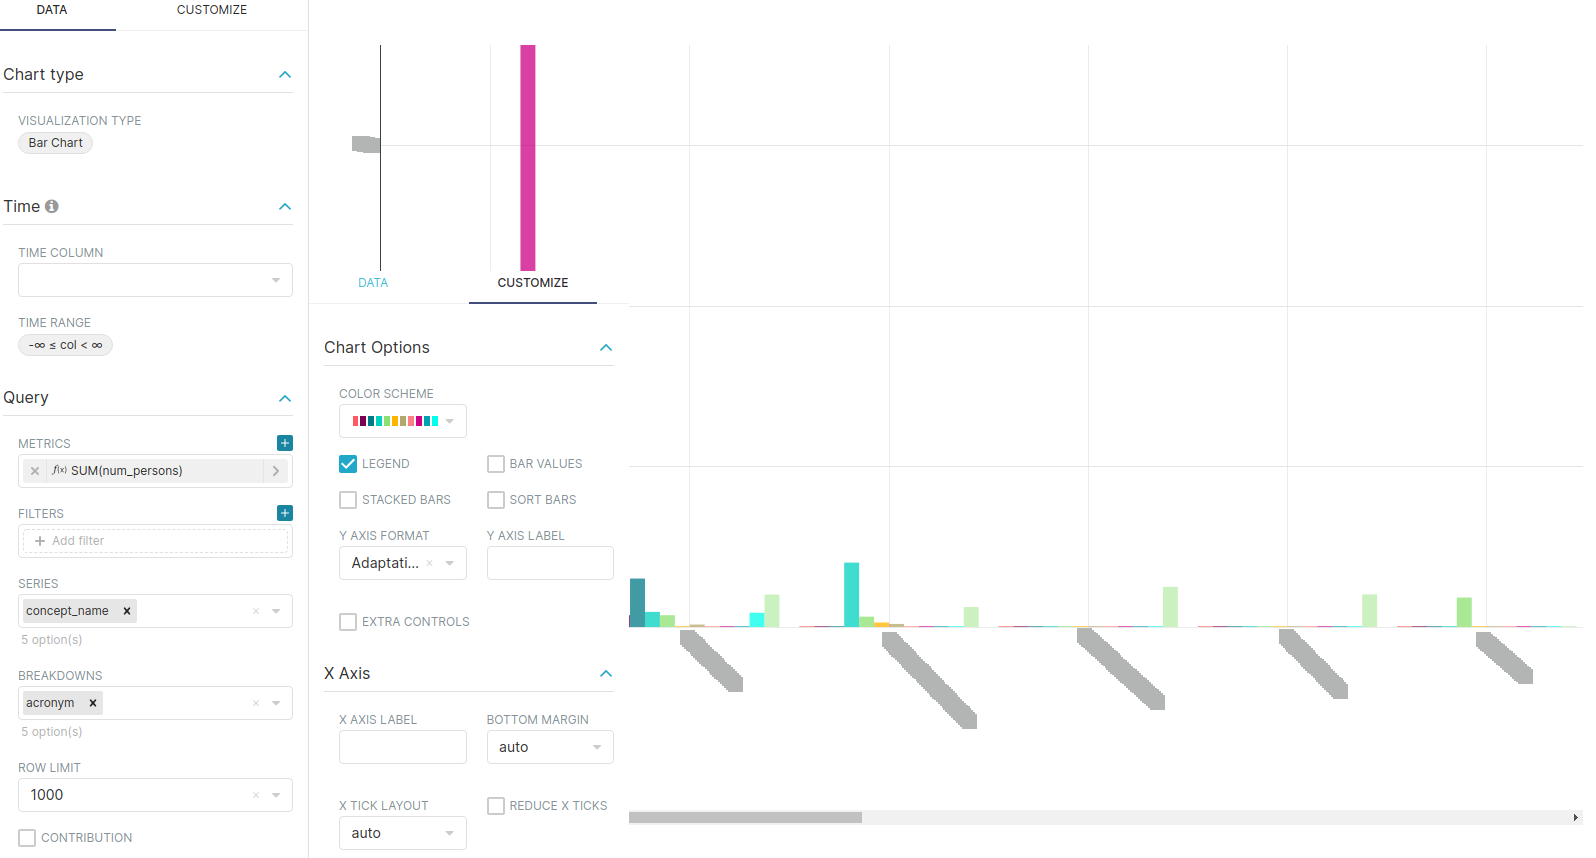
Number of distinct visit occurrence concepts per person
Dataset: Materialized View number_of_distinct_per_person
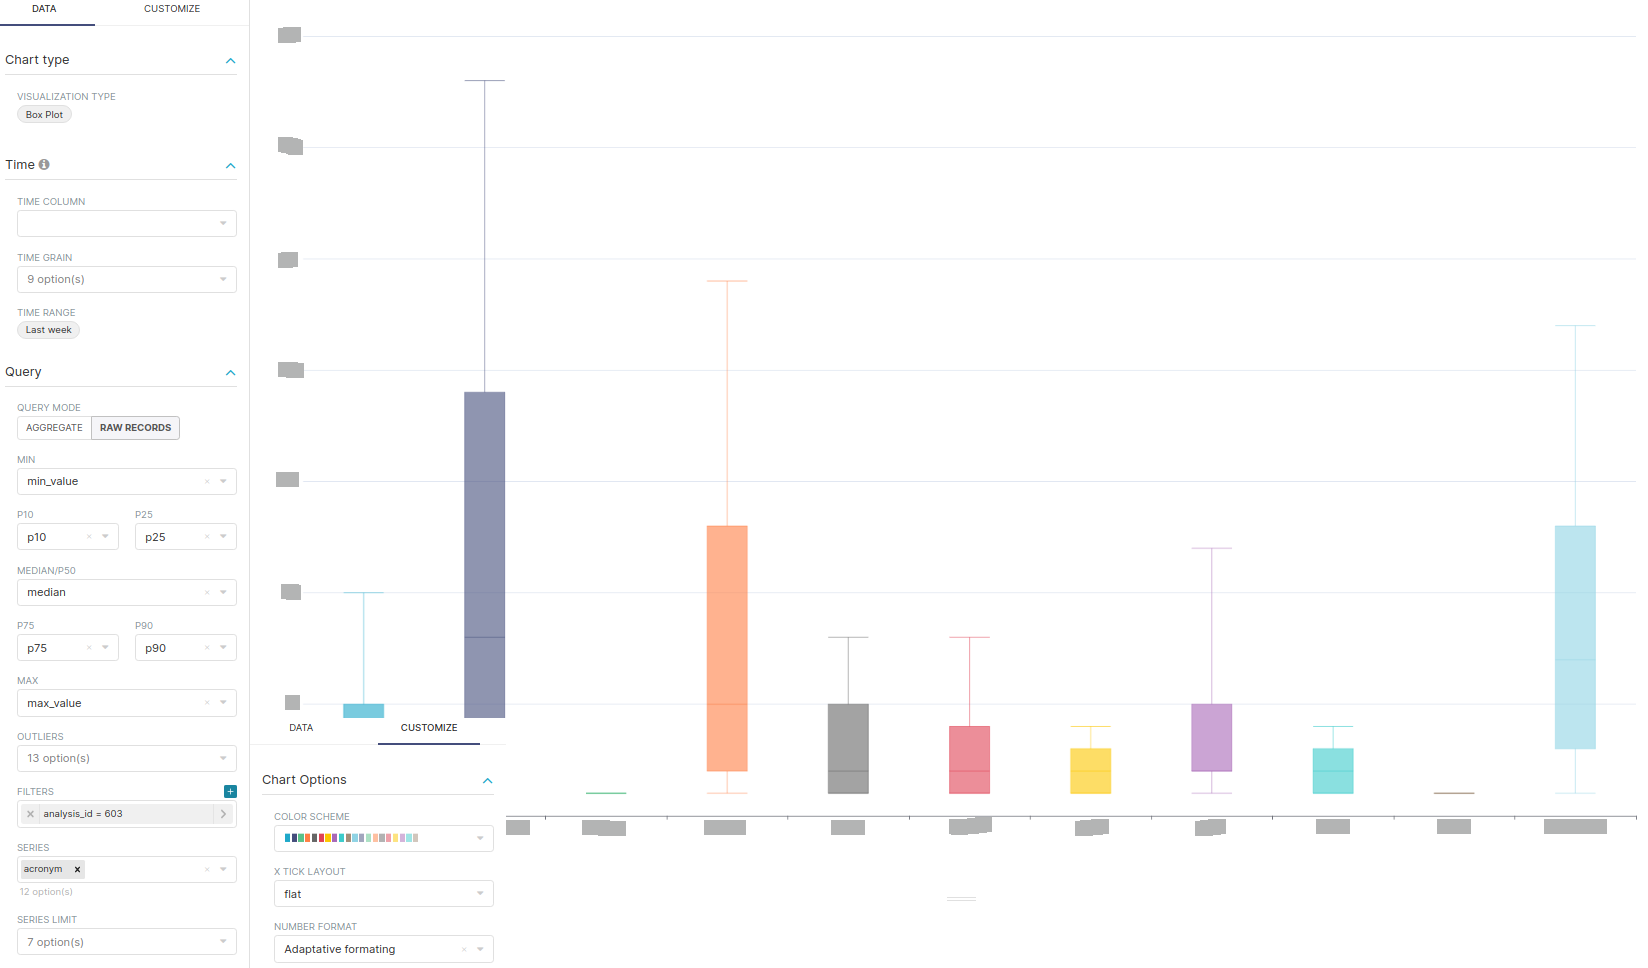
Number of distinct condition occurrence concepts per person
Dataset: Materialized View number_of_distinct_per_person
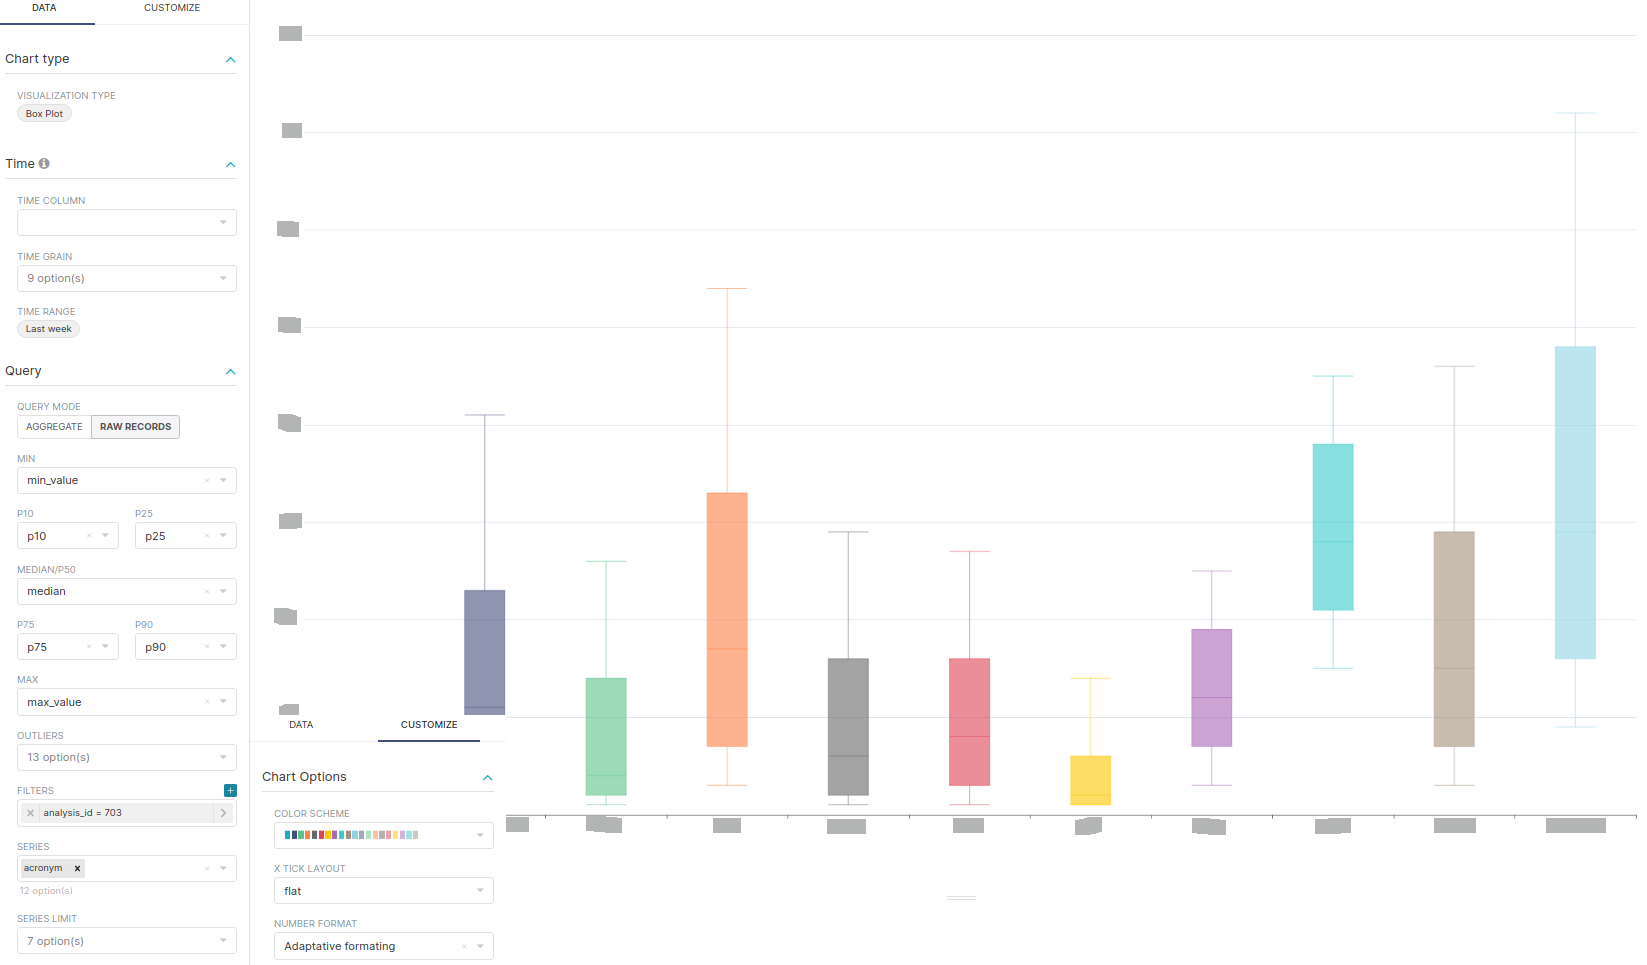
Number of distinct procedure occurrence concepts per person
Dataset: Materialized View number_of_distinct_per_person
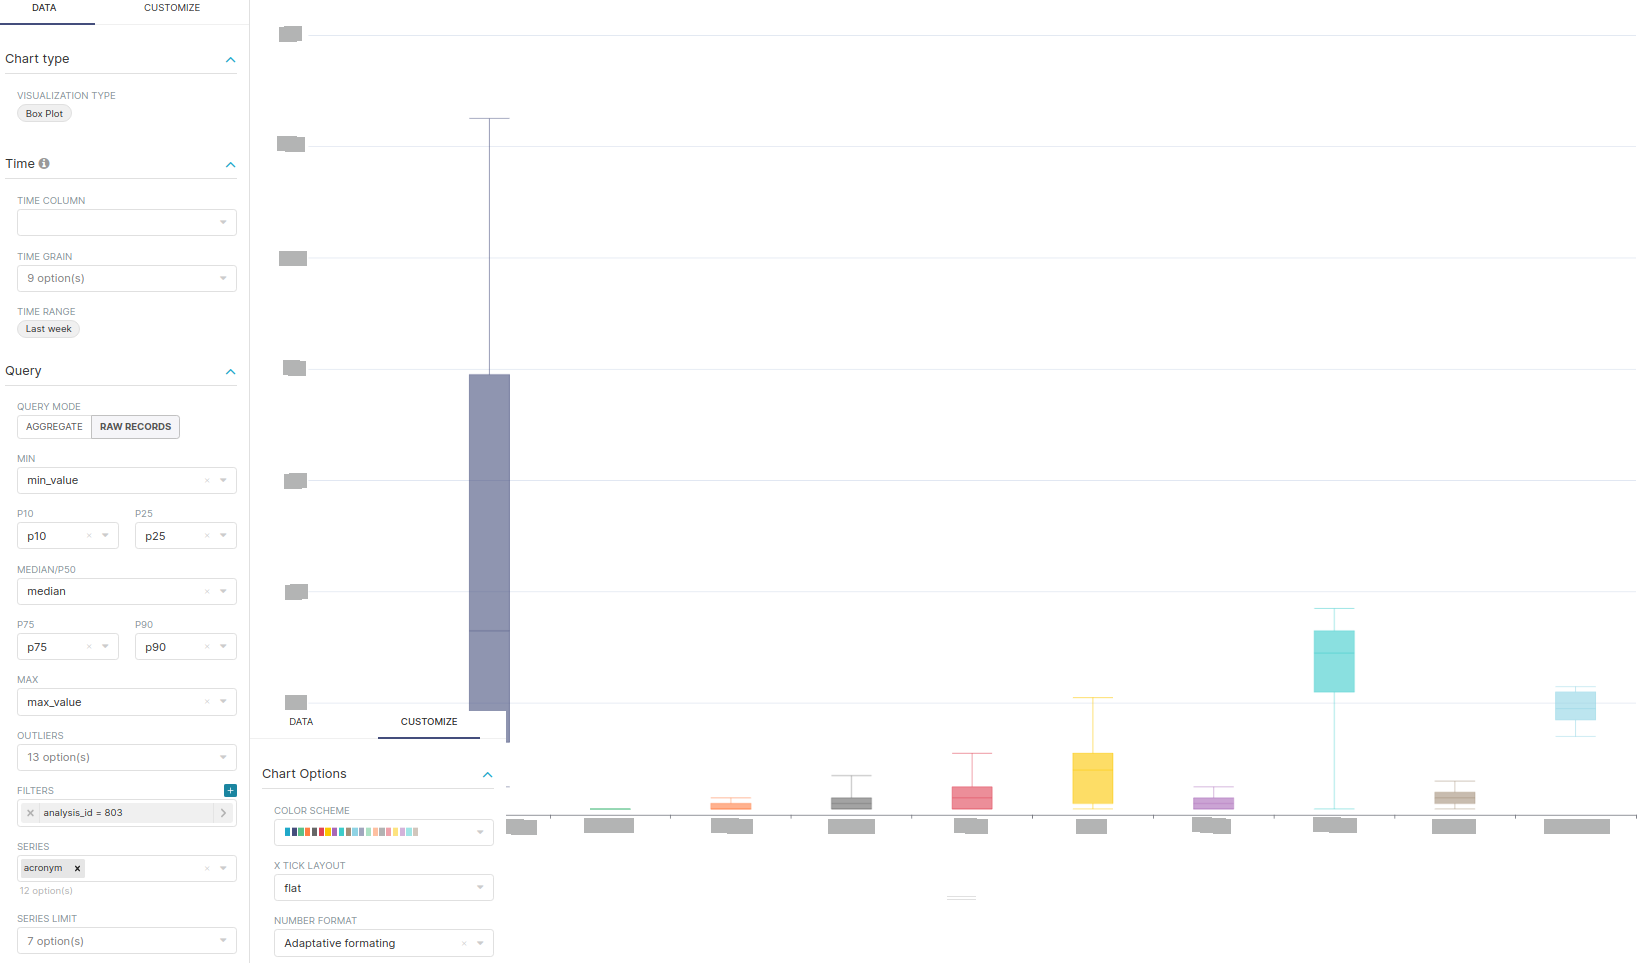
Number of distinct drug exposure concepts per person
Dataset: Materialized View number_of_distinct_per_person
Number of distinct observation occurrence concepts per person
Dataset: Materialized View number_of_distinct_per_person
Number of distinct mesurement occurrence concepts per person
Dataset: Materialized View number_of_distinct_per_person
Observation Period Tab
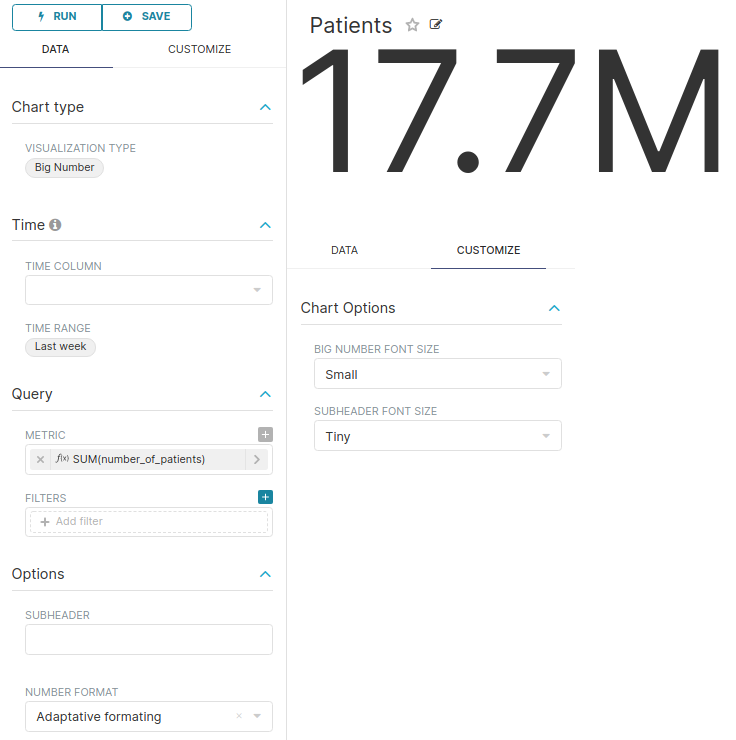
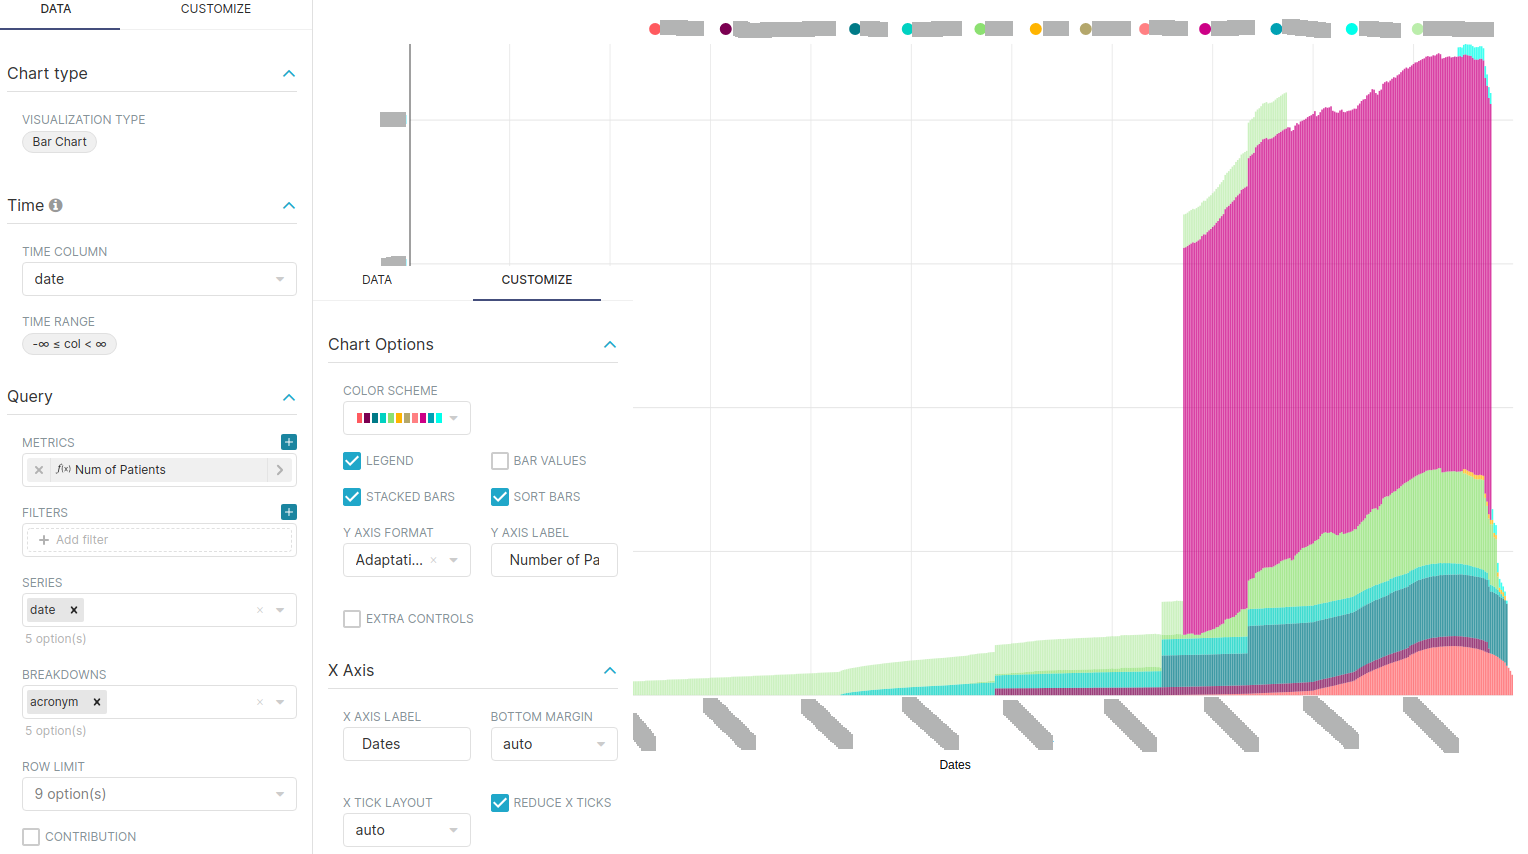
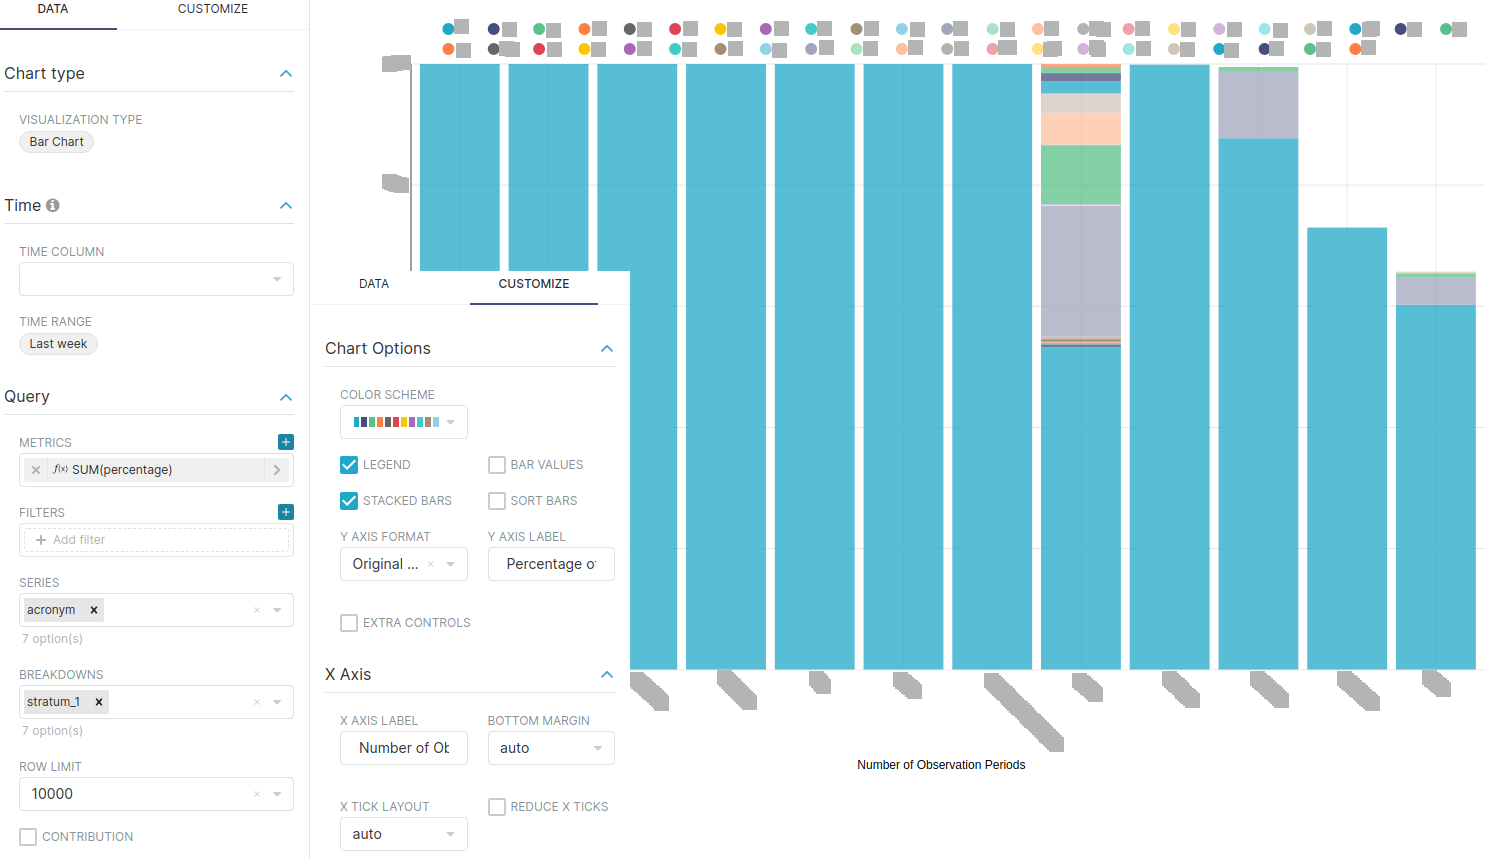
Number of Patitents in Observation Period
Dataset: Materialized View num_of_patients_in_observation_period
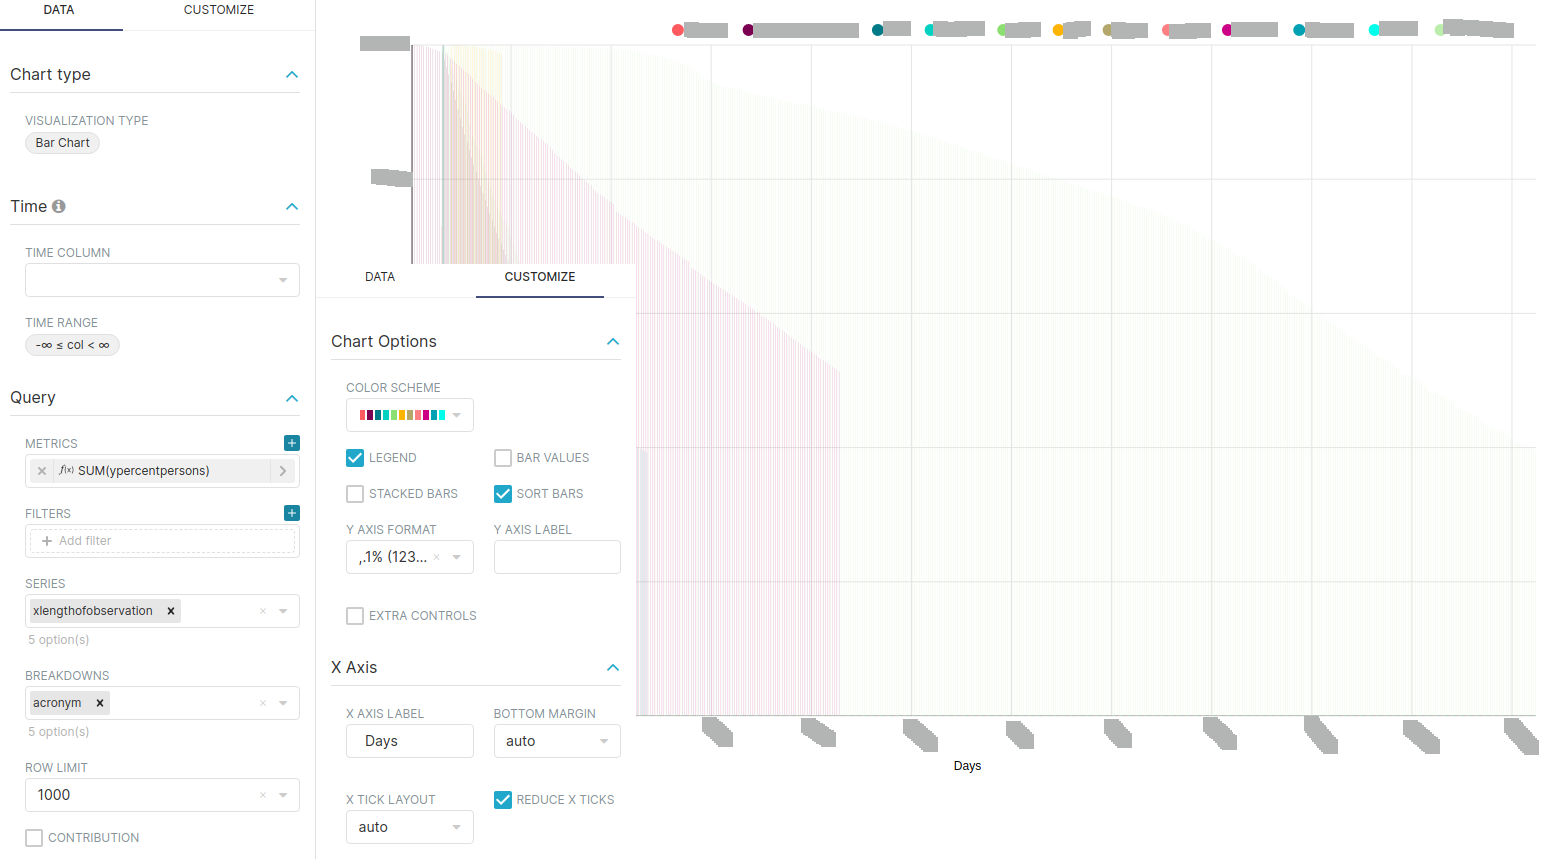
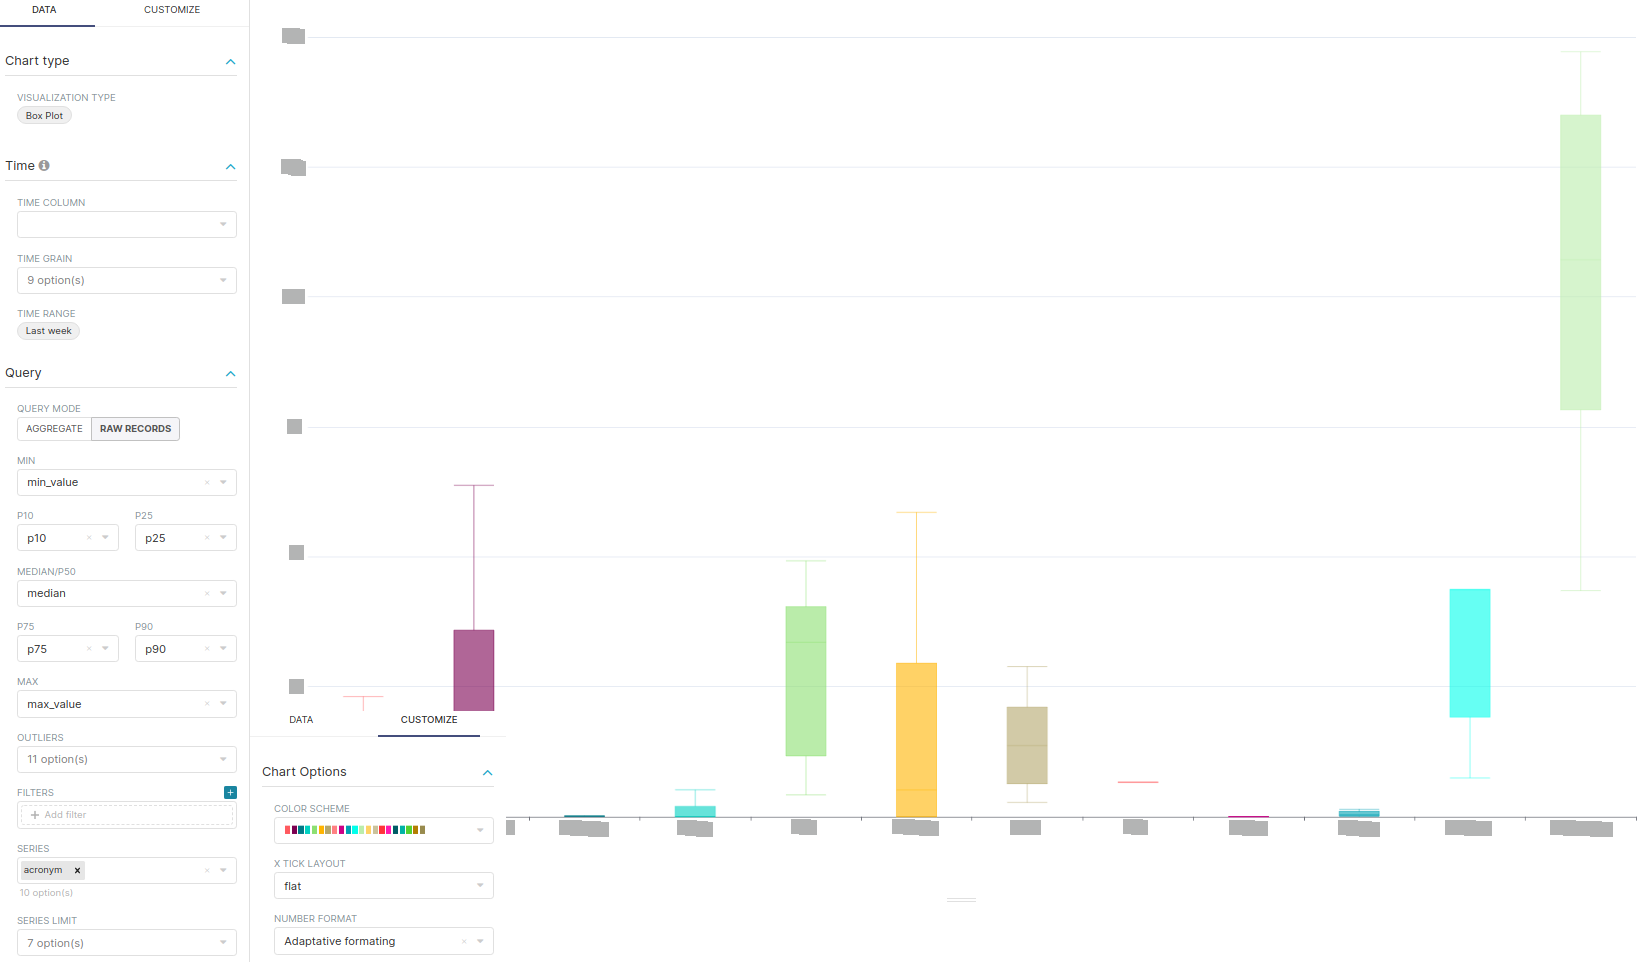
Length of observation (days) of first observation period
Dataset: Materialized View length_of_observation_of_first_observation_period
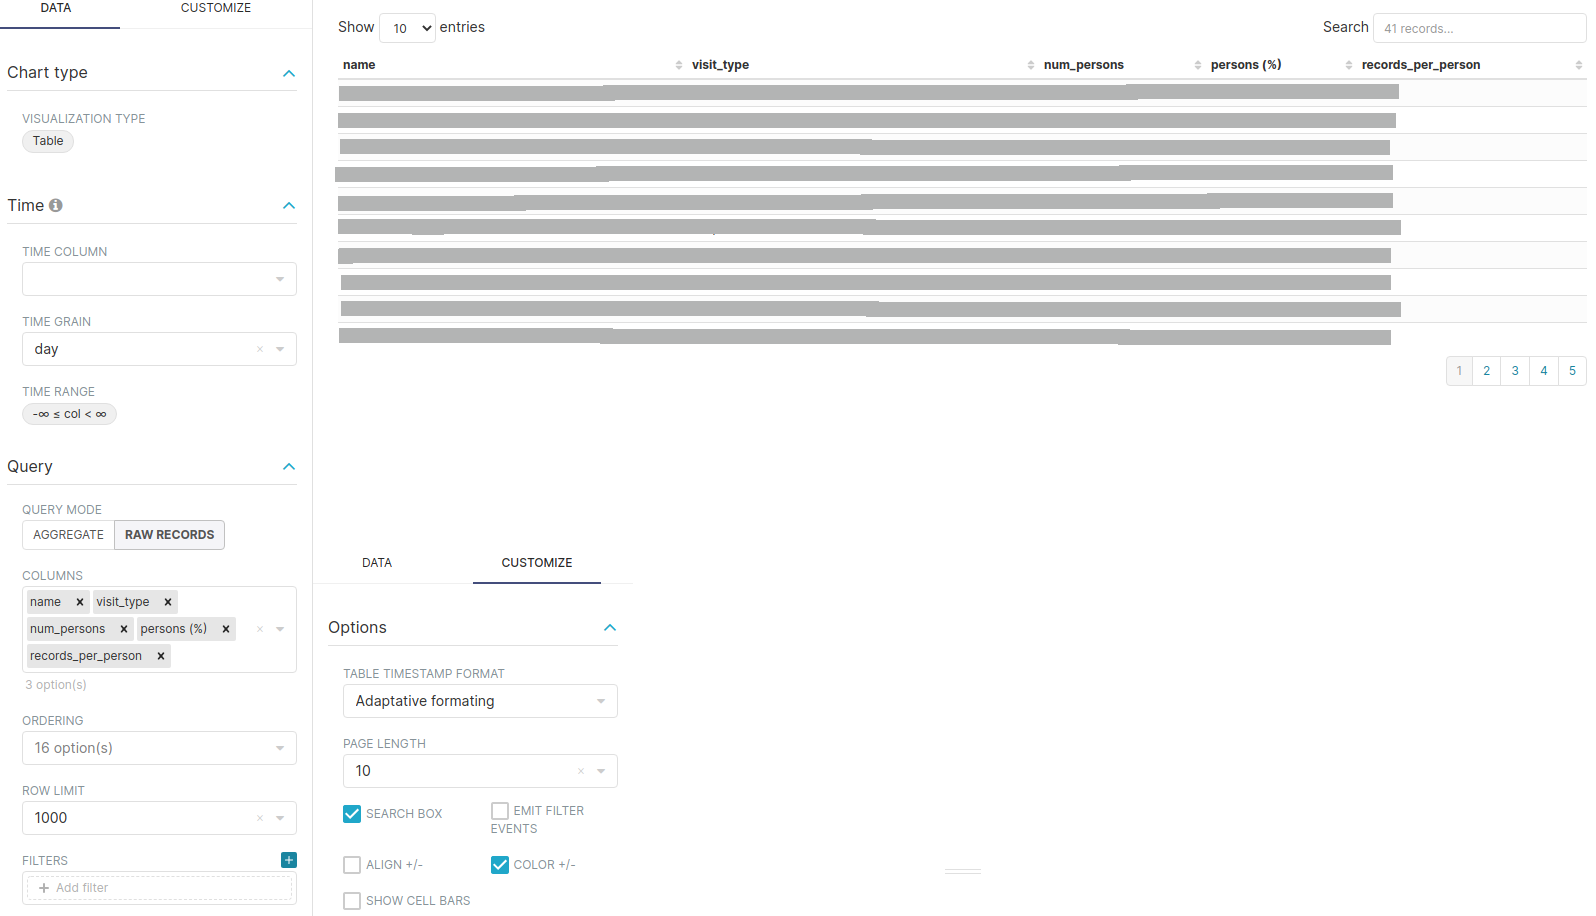
Visit Tab
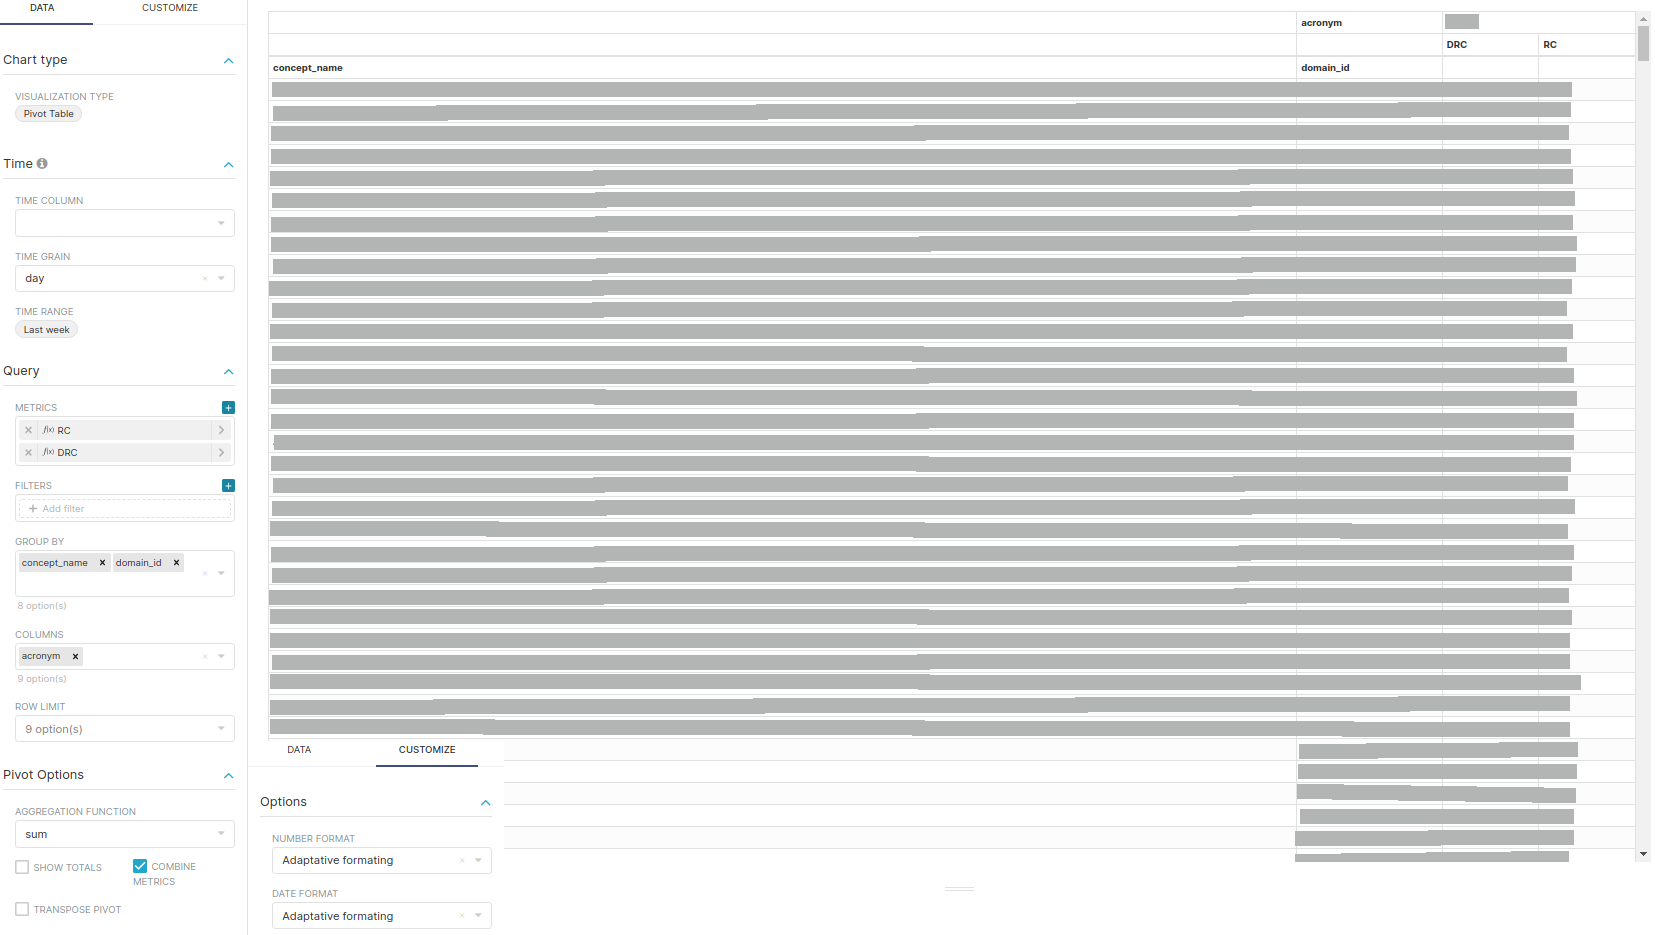
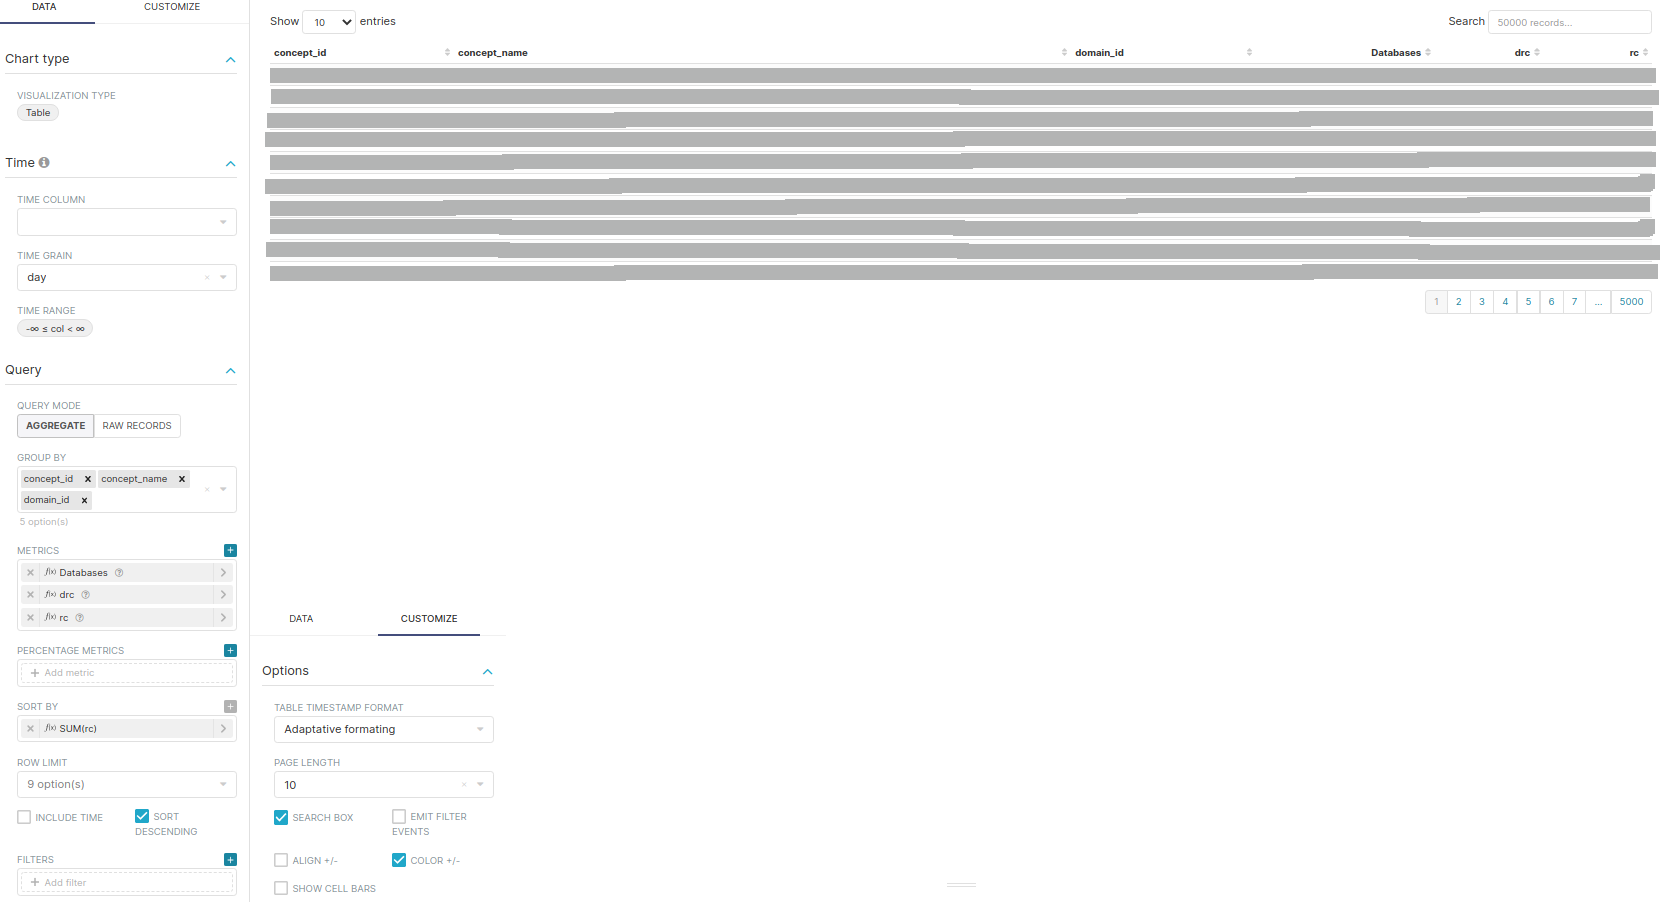
Concept Browser Tab
About Tab
Markdown dashboard components