9.4 General [Deprecated]
CSS
To hide the dashboard header insert the following css code to the CSS field on the edit page:
.dashboard > div:not(.dashboard-content) {  /* dashboard header */
  display: none;
}
With this every time you want to edit the dashboard layout you have to either comment the CSS inserted or remove it so the “Edit Dashboard” button can show again.
Database Type and Country Filter
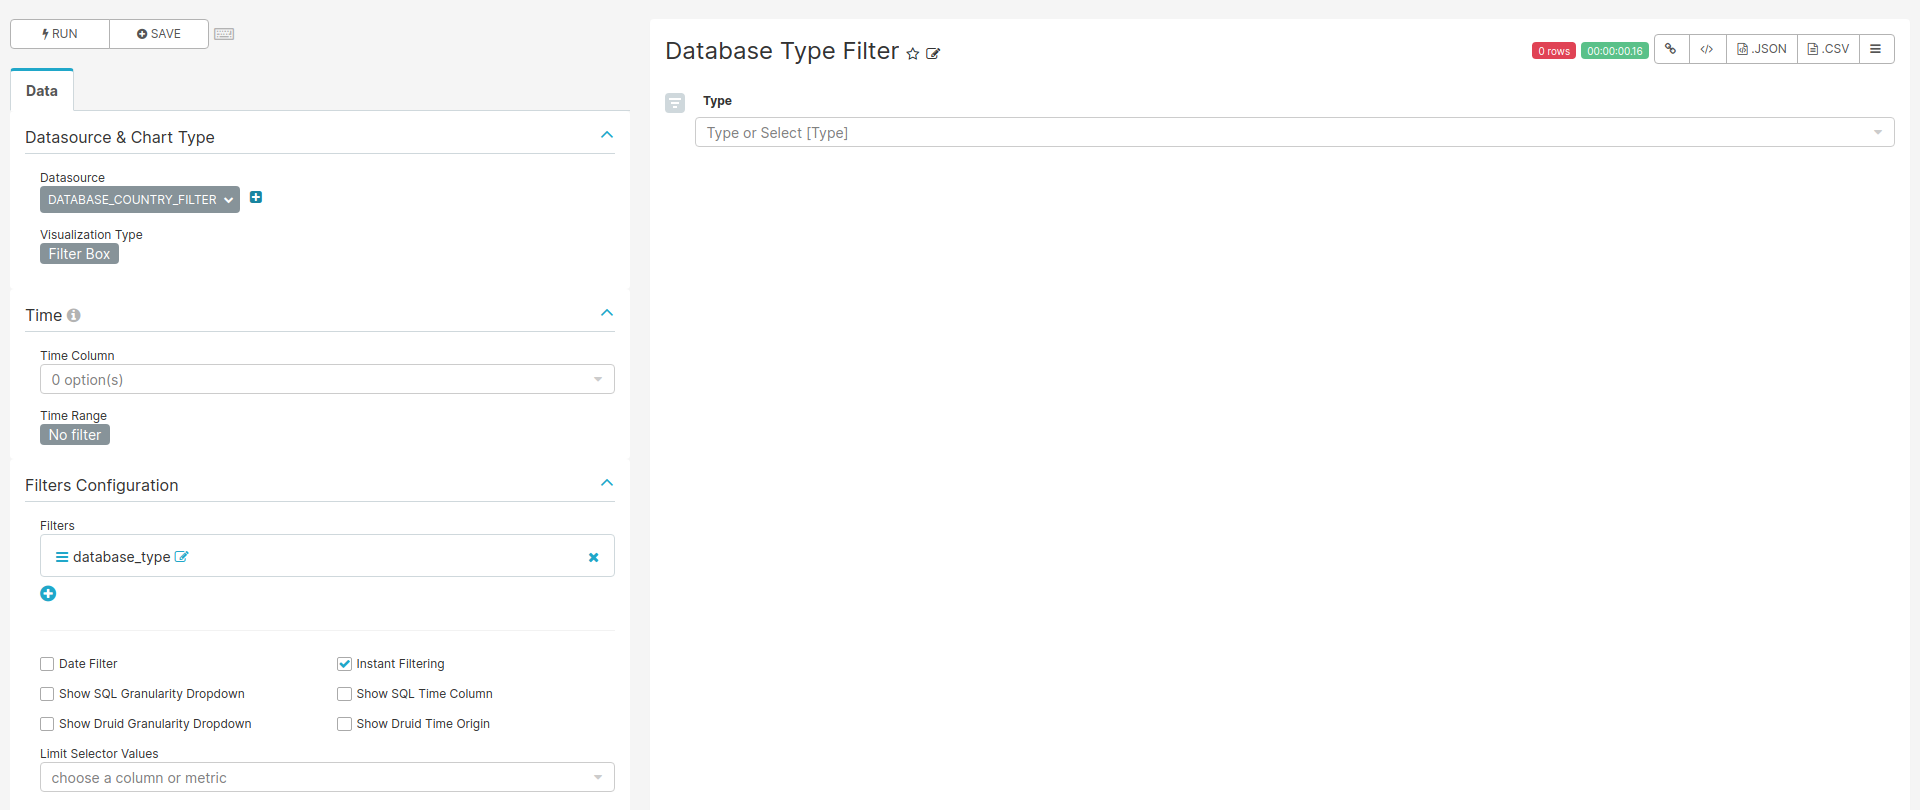
Figure 9.1: Settings for creating filters charts
Theses filter were designed to be used in the dashboard aiming the filtering of the data based on the field ‘’database_type’’ and “country” from the table ‘’data_source’’.
For the filters to work the name of the fields to filter should match in all tables used on the charts of this dashboard.
SQL query
SELECT source.name,
       country.country,
       source.database_type,
       source.acronym
FROM public.data_source AS source
INNER JOIN public.country AS country
  ON source.country_id=country.id
Chart settings
- Data Tab
- Datasource & Chart Type
- Visualization Type: Filter Box
- Time
- Time range: No filter
- Filters Configuration
- Filters:
- database_type or country
- Date Filter: off
- Instant Filtering: on
- Filters:
- Datasource & Chart Type
Total Number of Patients
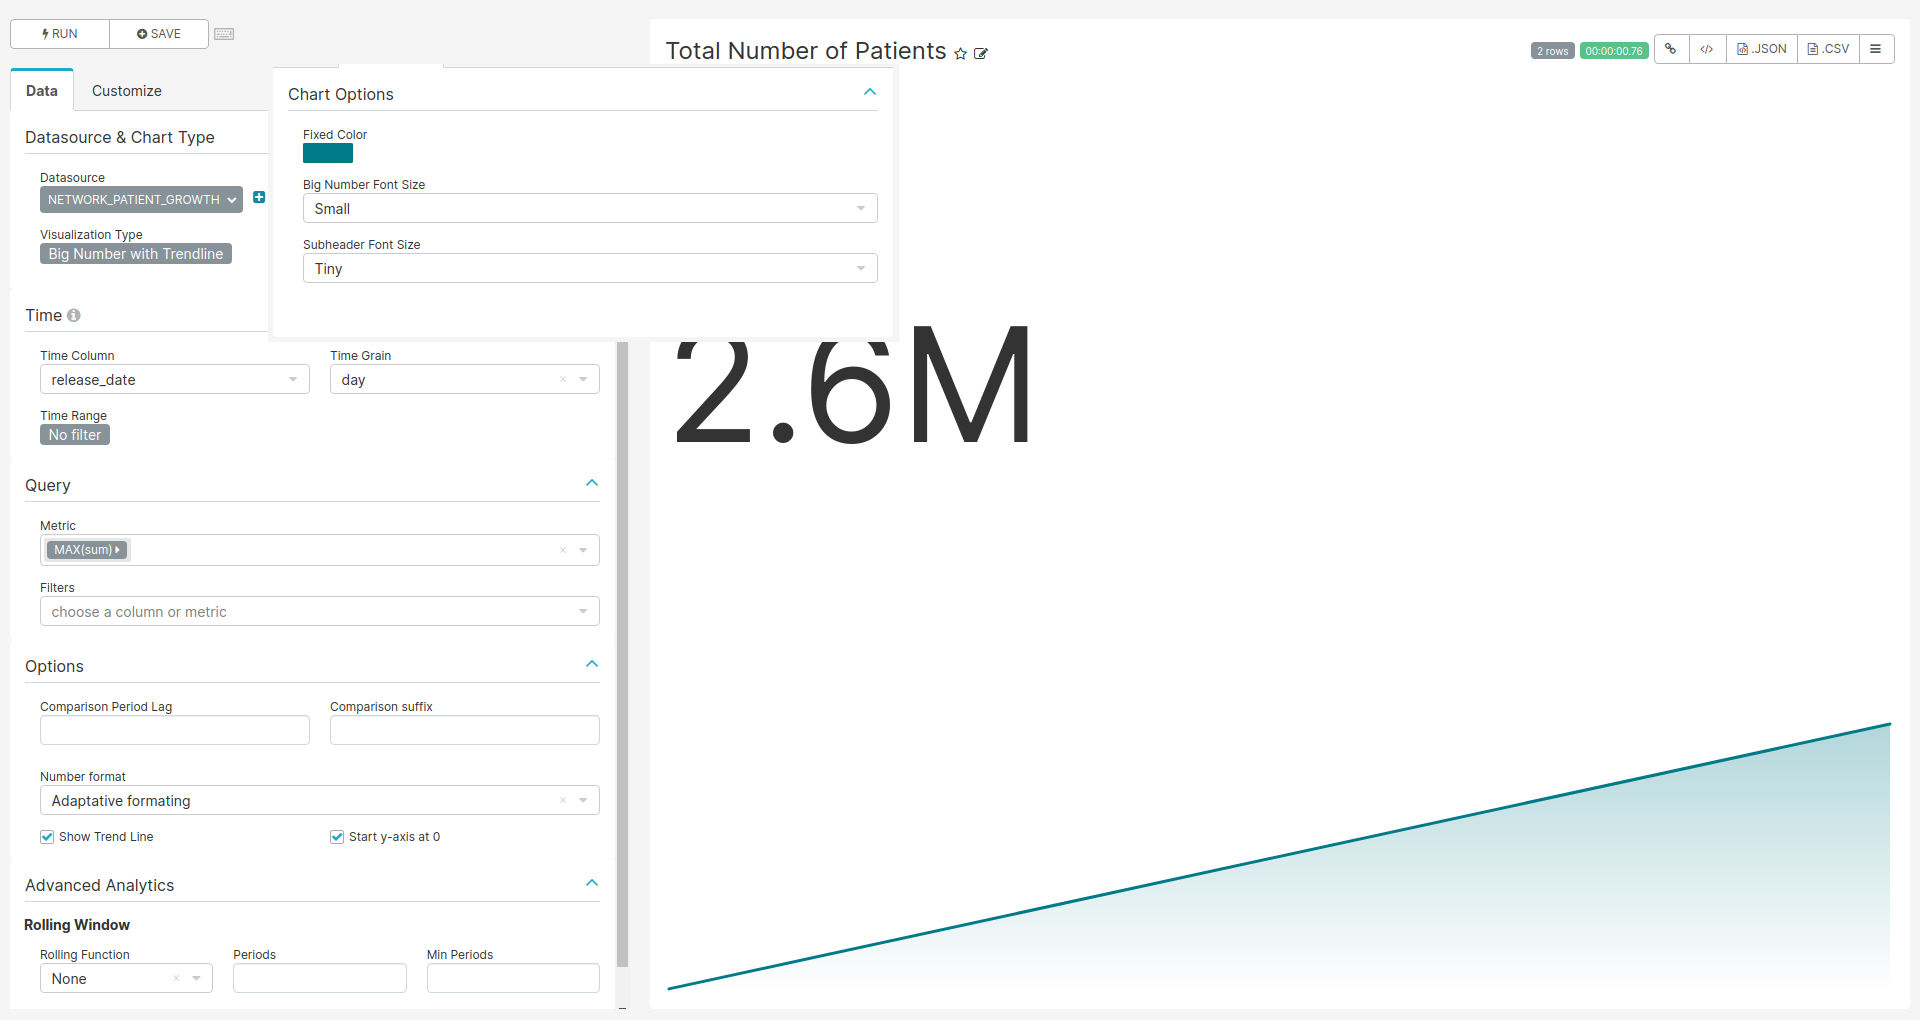
Figure 9.2: Settings for creating the Total Number of Patients chart
SQL query
SELECT
 country,
 database_type,
 release_date,
 SUM(count_value) OVER (ORDER BY release_date ASC)
FROM achilles_results
JOIN data_source ON data_source_id = data_source.id
JOIN country ON data_source.country_id = country.id
WHERE analysis_id = 1
Chart settings
- Data Tab
- Datasource & Chart Type
- Visualization Type: Big Number with Trendline
- Time
- Time range: No filter
- Query
- Metrics: MAX(sum)
- Series: release_date
- Breakdowns: source
- Datasource & Chart Type
- Customize Tab
- Chart Options
- Big Number Font Size: Small
- Subheader Font Size: Tiny
- Chart Options
Network Growth by Date
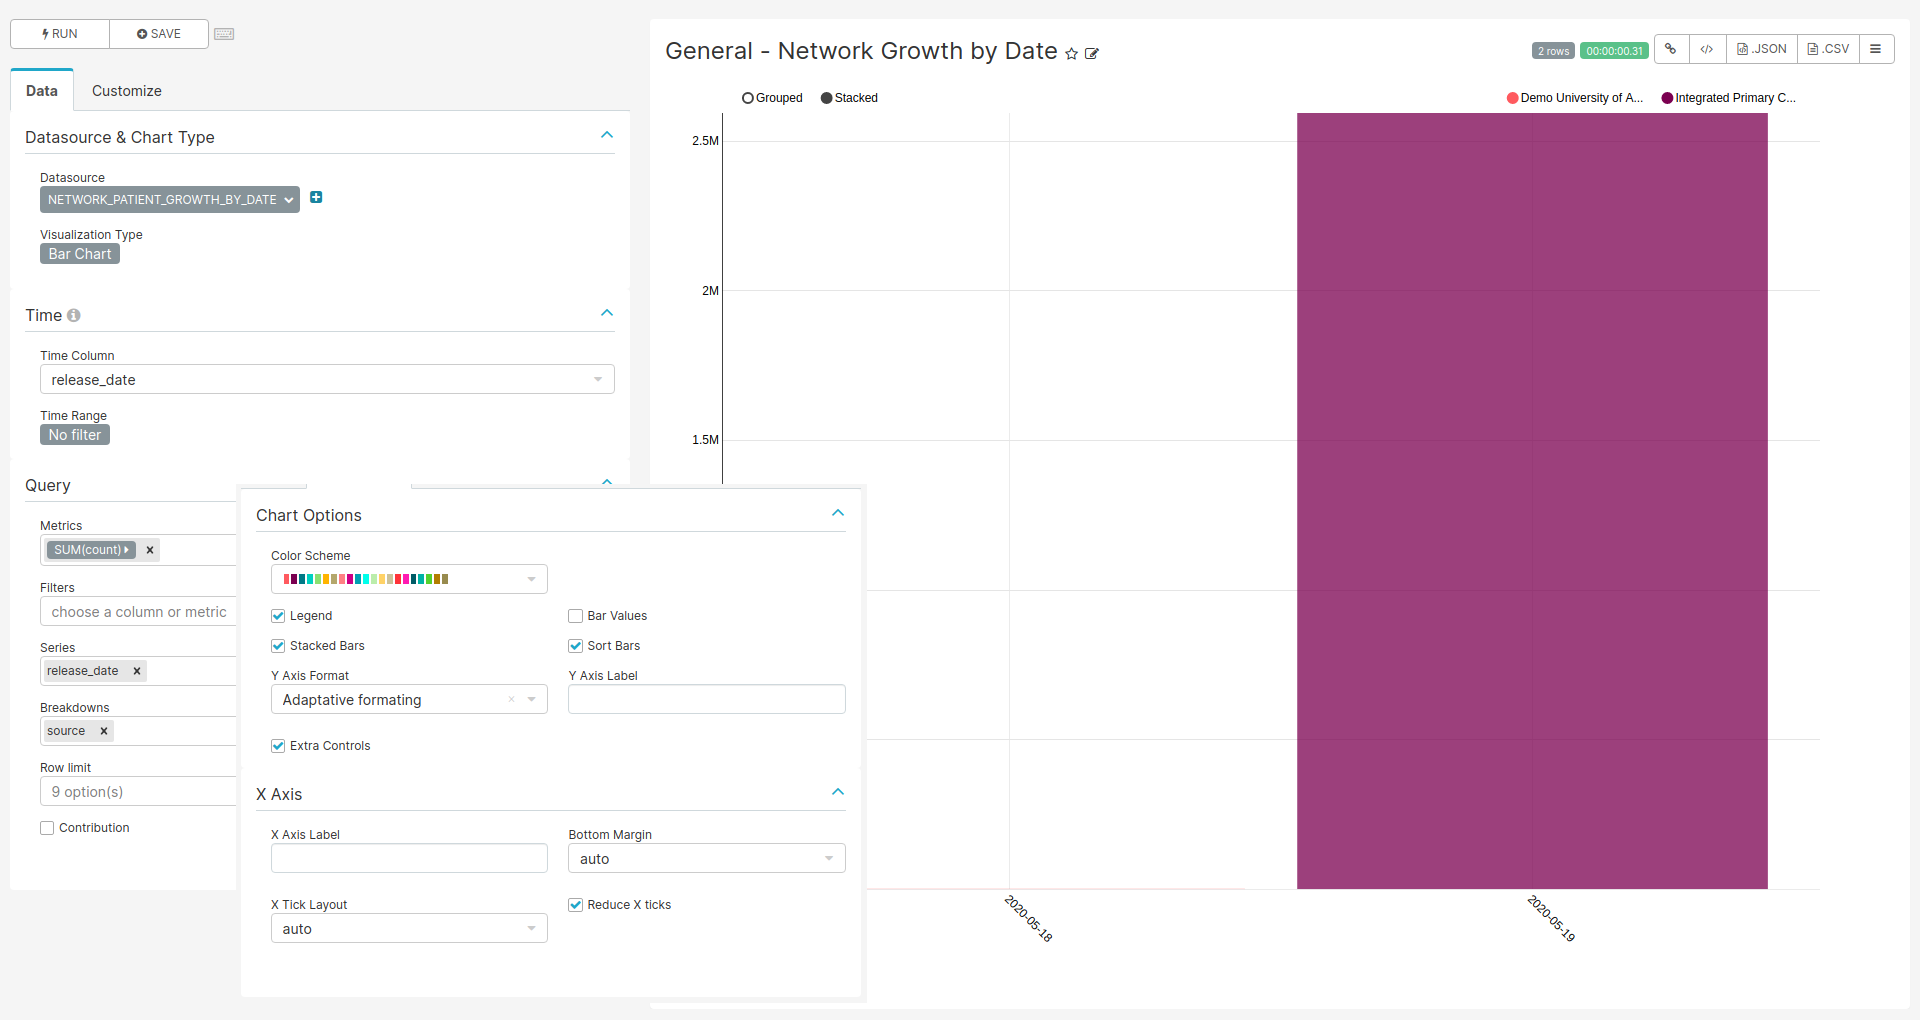
Figure 9.3: Settings for creating the Network Growth by Date chart
SQL query
SELECT  source.name AS source,
        country.country,
        source.database_type,
        source.release_date,
        concepts.concept_name AS gender,
        achilles.count_value as count
FROM public.achilles_results AS achilles
INNER JOIN public.data_source AS source
  ON achilles.data_source_id=source.id
INNER JOIN public.country AS country
  ON source.country_id=country.id
JOIN (
  SELECT '8507' AS concept_id, 'Male' AS concept_name
  UNION
  SELECT '8532', 'Female'
) AS concepts ON achilles.stratum_1 = concept_id
WHERE analysis_id = 2
Chart settings
- Data Tab
- Datasource & Chart Type
- Visualization Type: Bar Chart
- Time
- Time range: No filter
- Query
- Metrics: SUM(count_value)
- Series: release_date
- Breakdowns: source
- Datasource & Chart Type
- Customize Tab
- Chart Options
- Stacked Bars: on
- Sort Bars: on
- Extra Controls: on
- X Axis
- Reduce X ticks: on
- Chart Options
Patients per Country
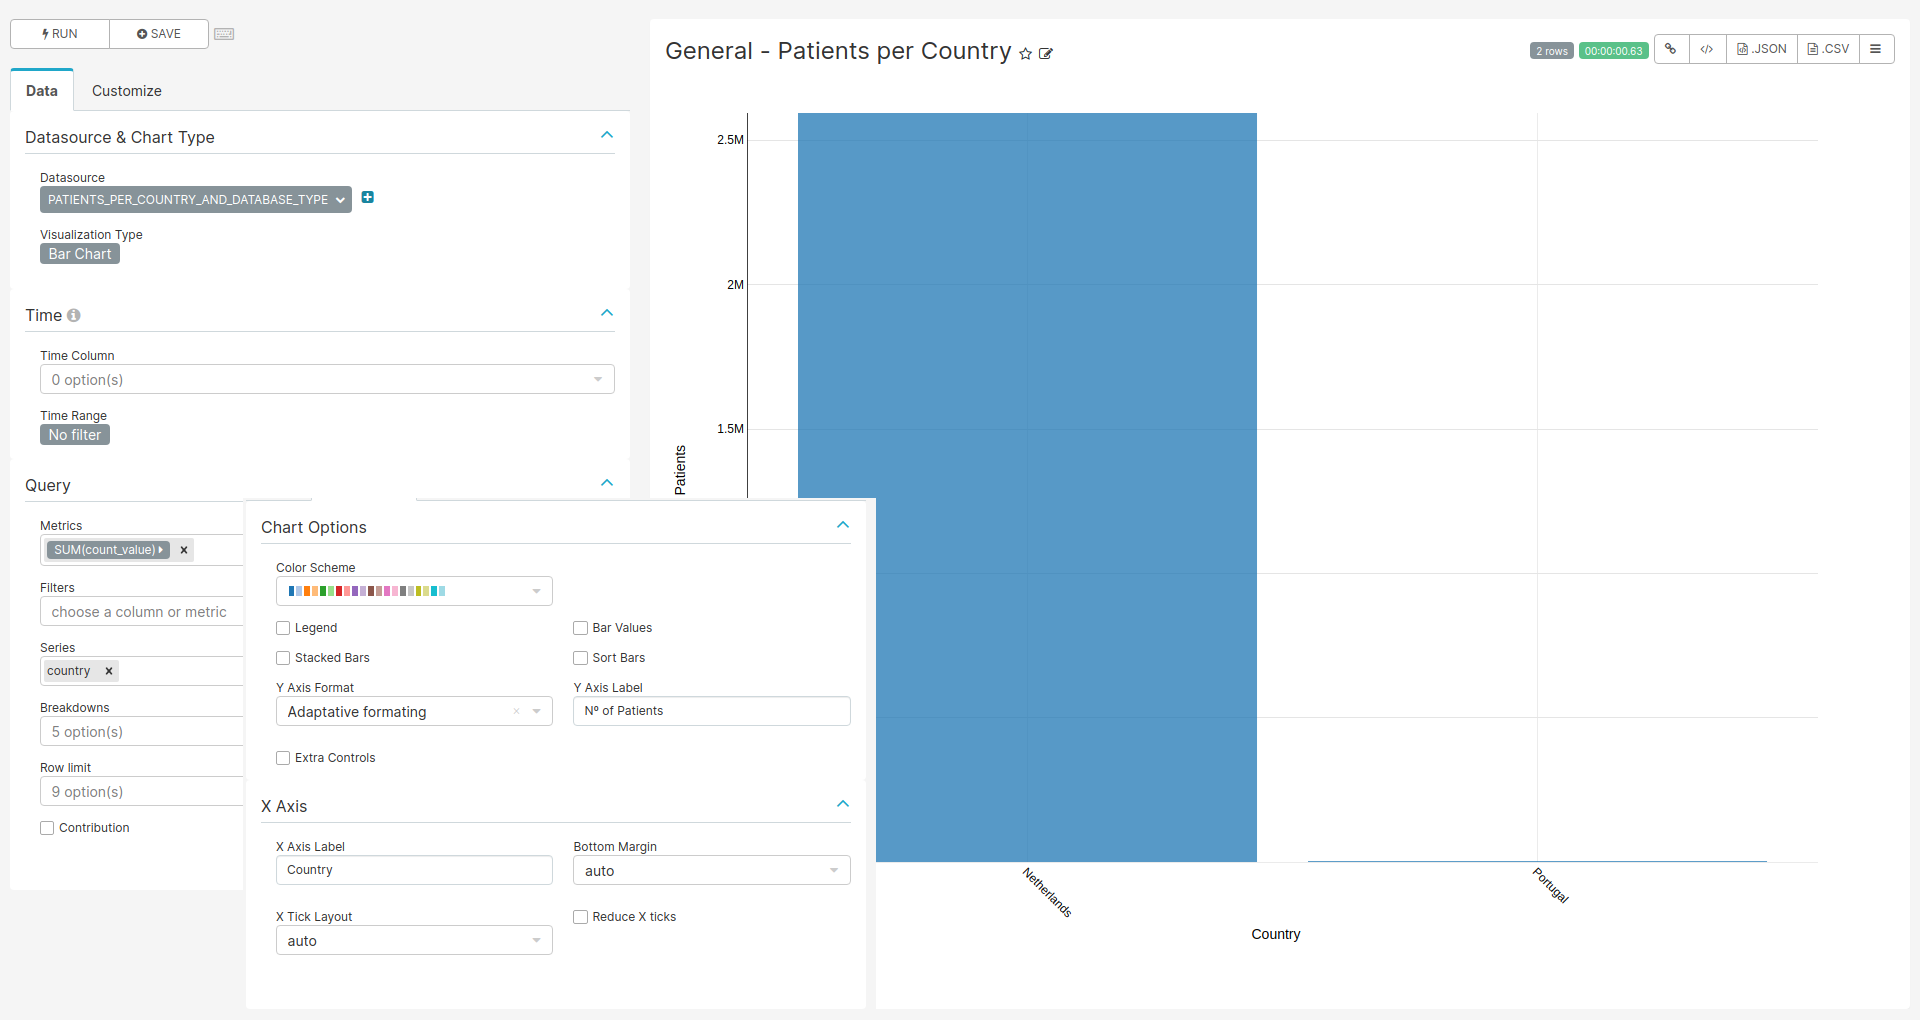
Figure 9.4: Settings for creating the Patients per Country chart
SQL query
SELECT country.country,
       source.database_type,
       count_value
FROM public.achilles_results AS achilles
INNER JOIN public.data_source AS source
  ON achilles.data_source_id=source.id
INNER JOIN public.country AS country
  ON source.country_id=country.id
WHERE analysis_id = 1
Chart settings
- Data Tab
- Datasource & Chart Type
- Visualization Type: Bar Chart
- Time
- Time range: No filter
- Query
- Metrics: SUM(count_value)
- Series: country
- Datasource & Chart Type
- Customize Tab
- Chart Options
- Legend: off
- Y Axis Label: Nº of Patients
- X Axis
- X Axis Label: Country
- Chart Options
Database Types per Country
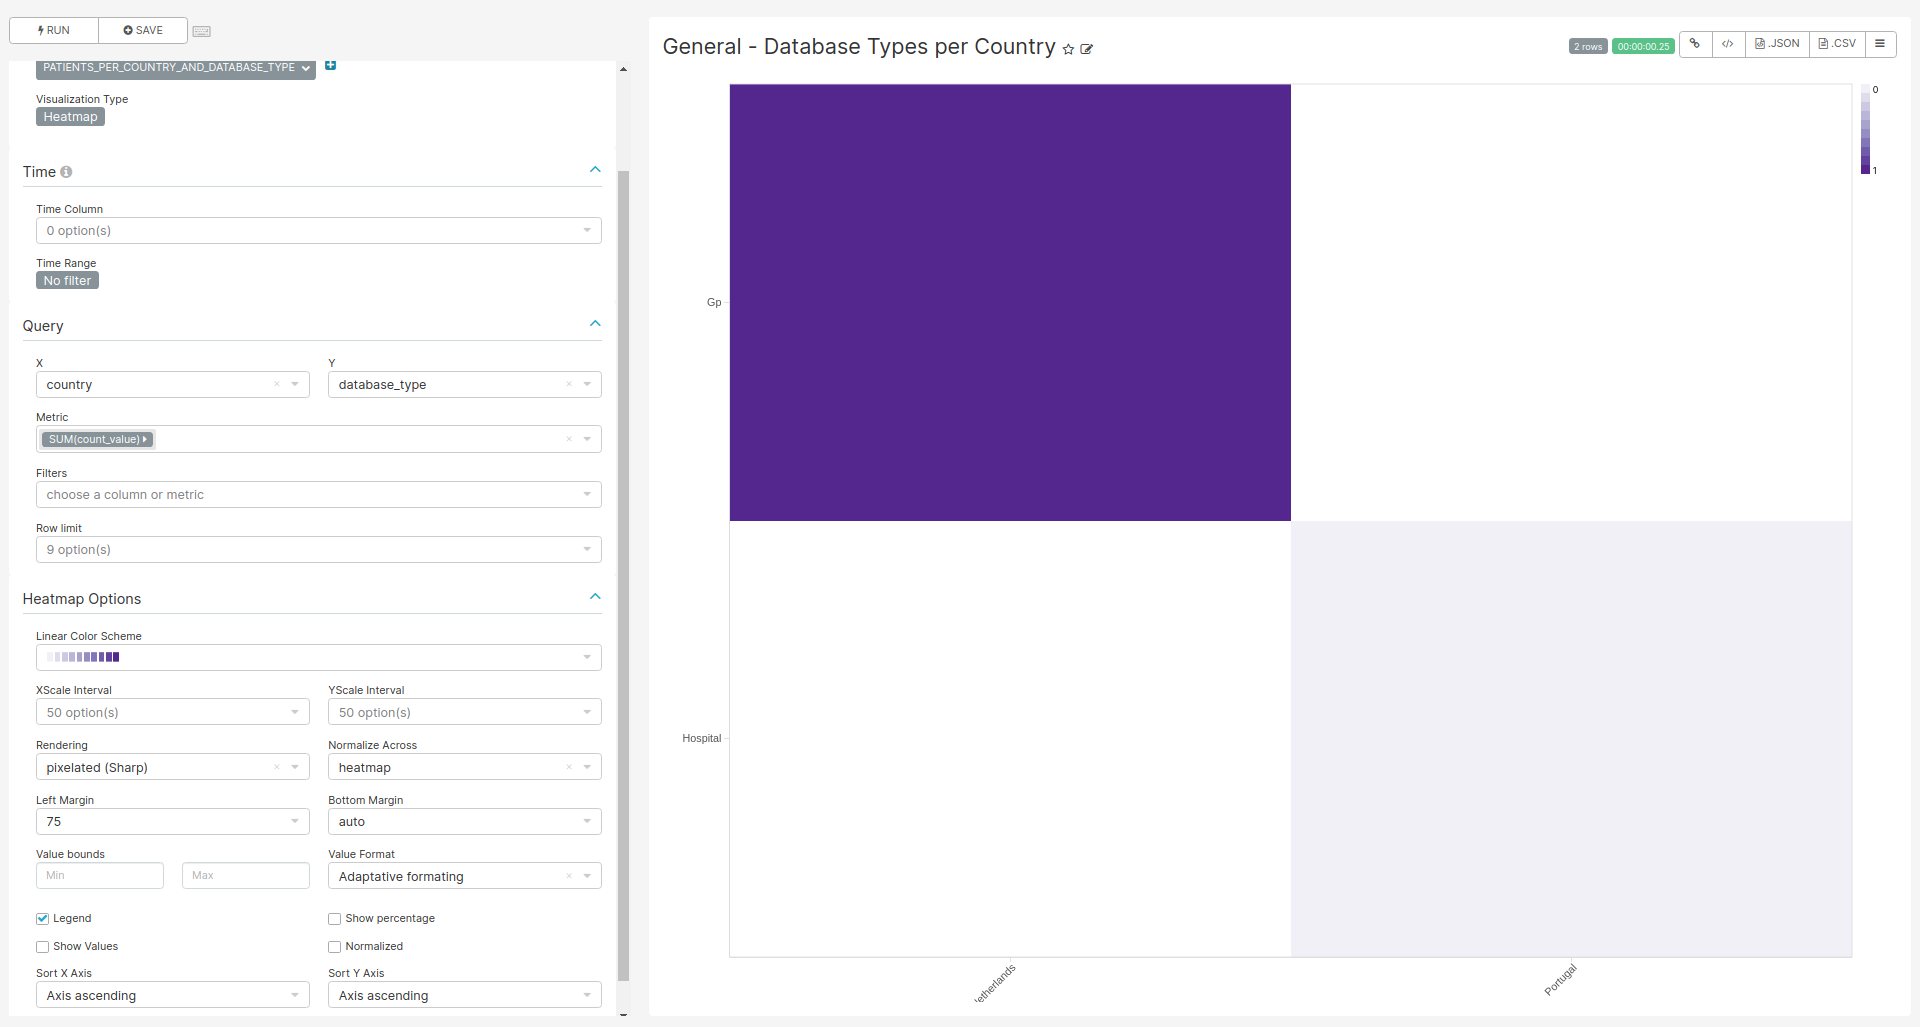
Figure 9.5: Settings for creating the Database Type per Country chart
SQL query
Same as Patients per Country query
Chart settings
- Data Tab
- Datasource & Chart Type
- Visualization Type: Heatmap
- Time
- Time range: No filter
- Query
- X: country
- Y: database_type
- Metric: SUM(countr_value)
- Heatmap Options
- Left Margin: 75
- Show Percentage: off
- Datasource & Chart Type
World Map
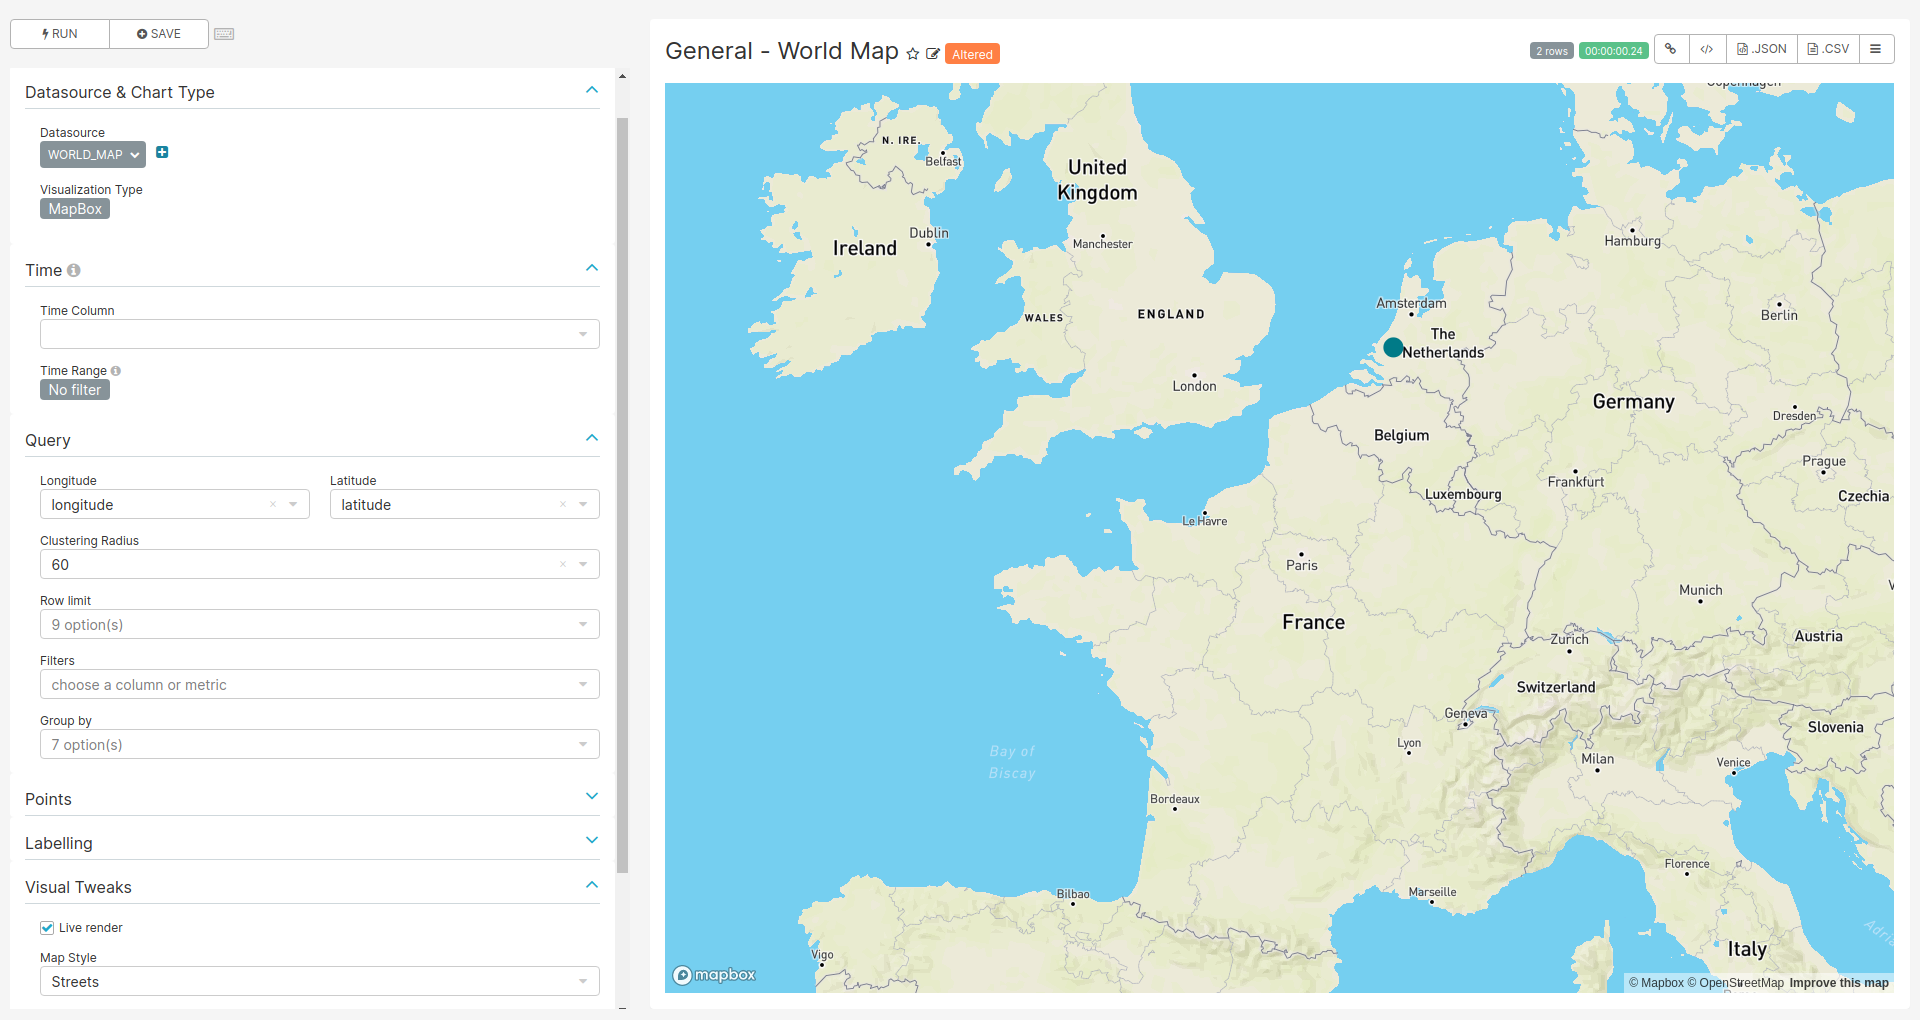
Figure 9.6: Settings for creating the World Map chart
SQL query
SELECT  name,
        acronym,
        database_type,
        latitude,
        longitude,
        country
FROM public.data_source AS source
INNER JOIN public.country AS country
  ON source.country_id=country.id
Chart settings
- Data Tab
- Datasource & Chart Type
- Visualization Type: MapBox
- Time
- Time range: No filter
- Query
- Longitude: longitude
- Latitude: latitude
- Visual Tweaks
- Map Style: Streets or Light or Outdoors
- Datasource & Chart Type
Meta Data
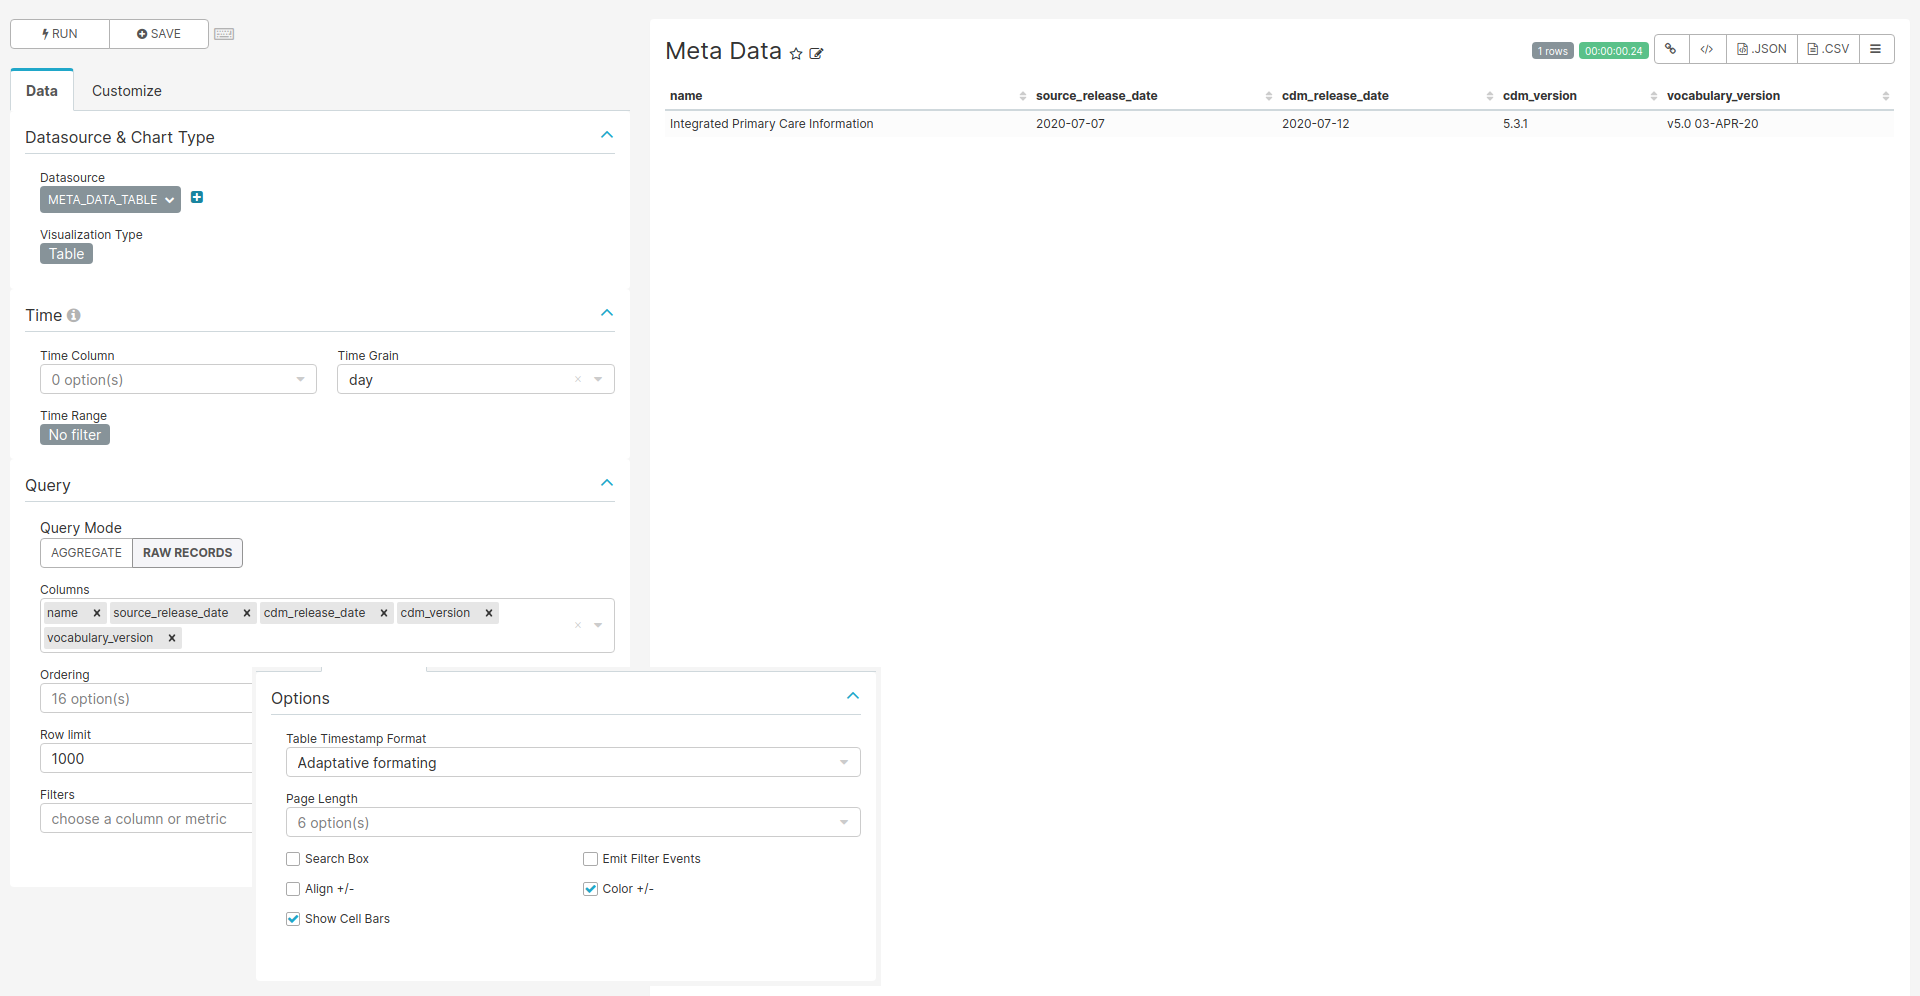
Figure 9.7: Settings for creating the Meta Data chart
SQL query
SELECT
  acronym,
  stratum_1 as "name",
  database_type,
  country,
  stratum_2 as "source_release_date",
  stratum_3 as "cdm_release_date",
  stratum_4 as "cdm_version",
  stratum_5 as "vocabulary_version"
FROM achilles_results
JOIN data_source
  ON achilles_results.data_source_id = data_source.id
JOIN country ON data_source.country_id = country.id
WHERE analysis_id=5000
Chart settings
- Data Tab
- Datasource & Chart Type
- Visualization Type: Table
- Time
- Time range: No filter
- Query
- Query Mode: Raw Records
- Columns: name, source_release_date, cdm_release_date, cdm_version, vocabulary_version
- Datasource & Chart Type