9.2 Database-Level Dashboard
This dashboard is an exact copy of the Network Dashboard dashboard but several legends and fields displayed on the original are hidden either through CSS or by changing some chart settings. On the following sections we will only present the things to change on the original charts.
Label Colors
In order to obtain the colors blue and rose in the chart representing the gender distribution,
add the following JSON entry to the JSON object of the JSON Metadata field on the edit dashboard page:
"label_colors": {
    "Male": "#3366FF",
    "Female": "#FF3399"
}
CSS
To hide the dashboard header insert the following css code to the CSS field on the edit page:
/* hides the filter badges on right side of charts */
.dashboard-filter-indicators-container {
display: none;
}
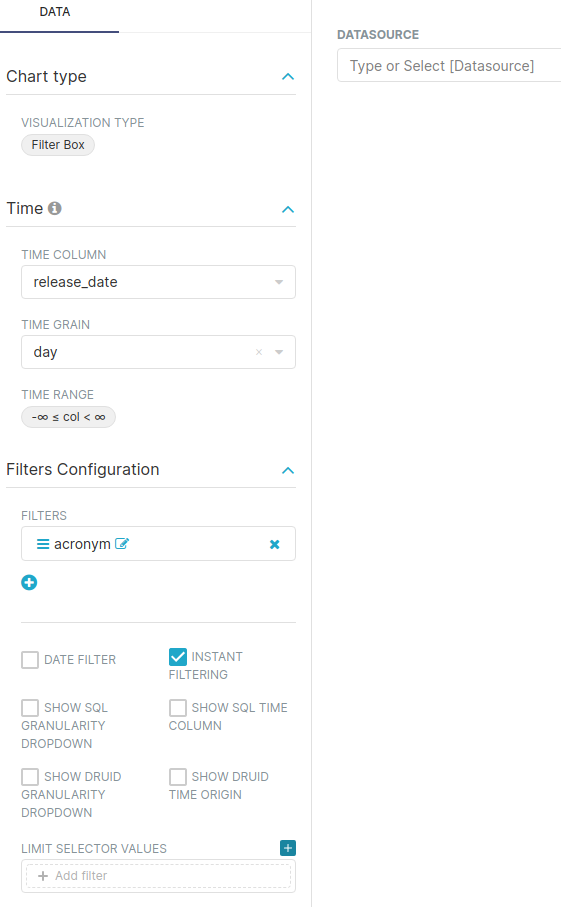
/* hides the acronym filter */
.grid-content > .dragdroppable.dragdroppable-row > .with-popover-menu {
display: none;
}
/*
* WARNING panel 1 id hardcoded
* Hides the X Axis Label of the heatmap on the Data Domains tab
*/
#TABS-nlIU6H5mcT-pane-1 g.x.axis > g.tick text {
display: none;
}
/*
* WARNING panel 2 id hardcoded
* Hides the X Axis Labels of the bar charts on the Data Provenance tab
*/
#TABS-nlIU6H5mcT-pane-2 g.nv-x.nv-axis.nvd3-svg > g.nvd3.nv-wrap.nv-axis > g > g.tick.zero > text {
display: none;
}With this every time you want to edit the dashboard layout you have to either comment the CSS inserted or remove it so the “Edit Dashboard” button can show again.
Demographics Tab
Number of Patients
No changes
Gender Table
No changes
Gender Pie
No changes
Age at first observation - Bars
Remove legend.
- Customize Tab
- Chart Options
- Legend: off
- Chart Options
Distribution of age at first observation period
No changes
Year of Birth
Remove legend.
- Customize Tab
- Chart Options
- Legend: off
- Chart Options
Data Domains Tab
Average number of records per person
No changes
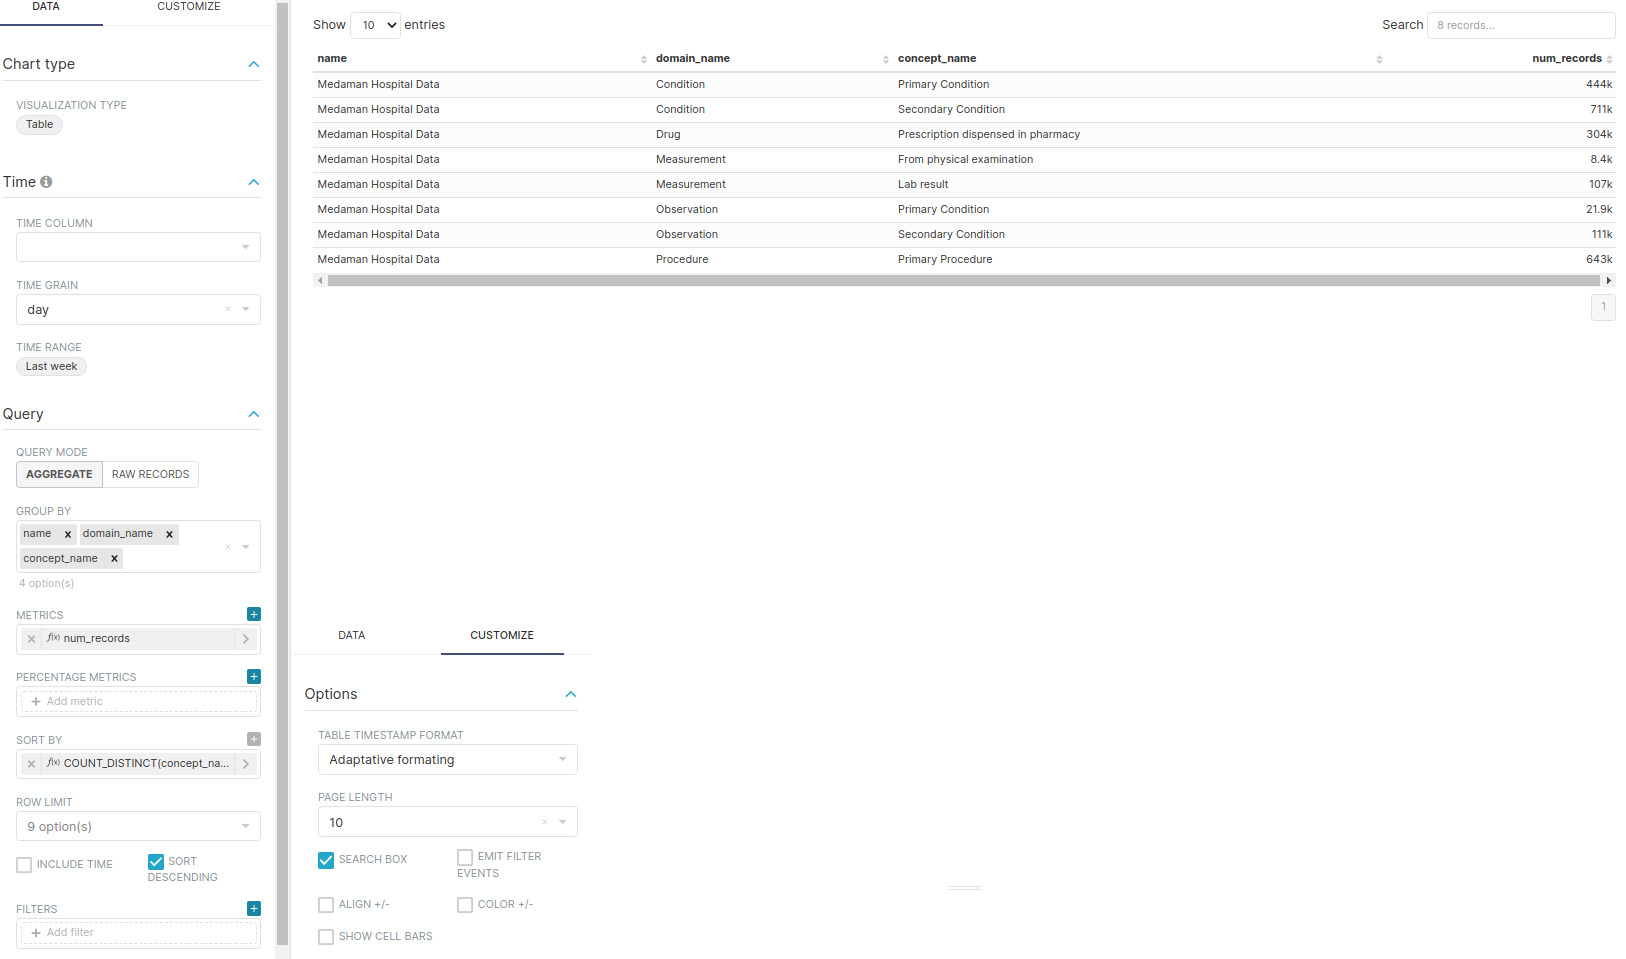
Total number of records
No changes
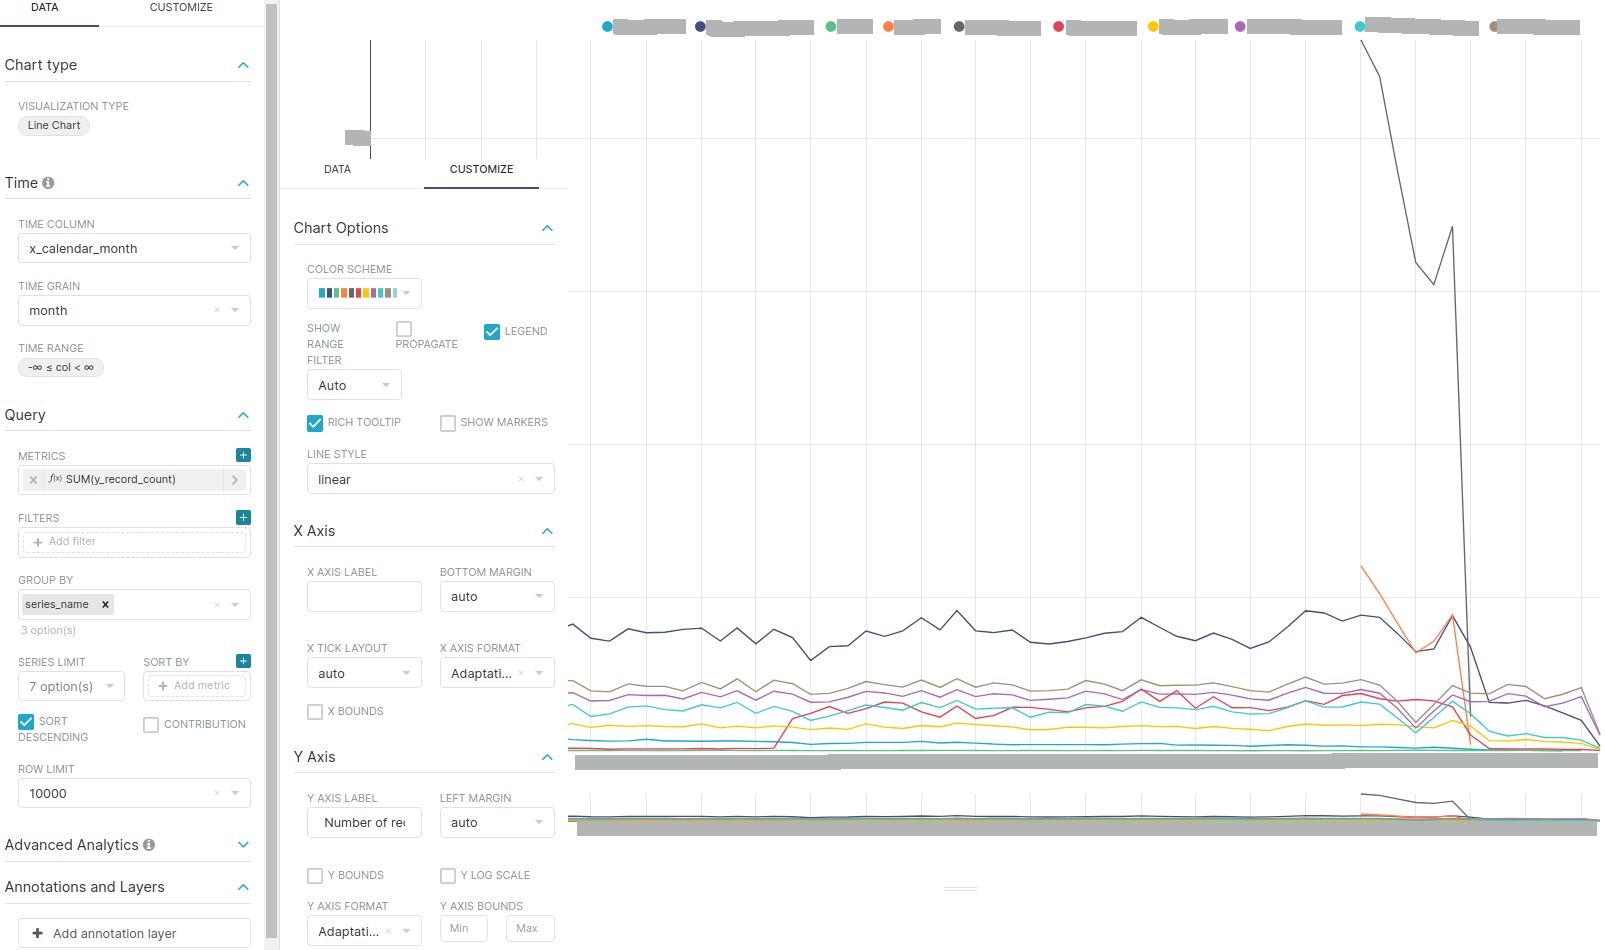
Data Provenance Tab
Observation Period Tab
Number of Patitents in Observation Period
Remove legend.
- Customize Tab
- Chart Options
- Legend: off
- Chart Options
Length of observation (days) of first observation period
No changes
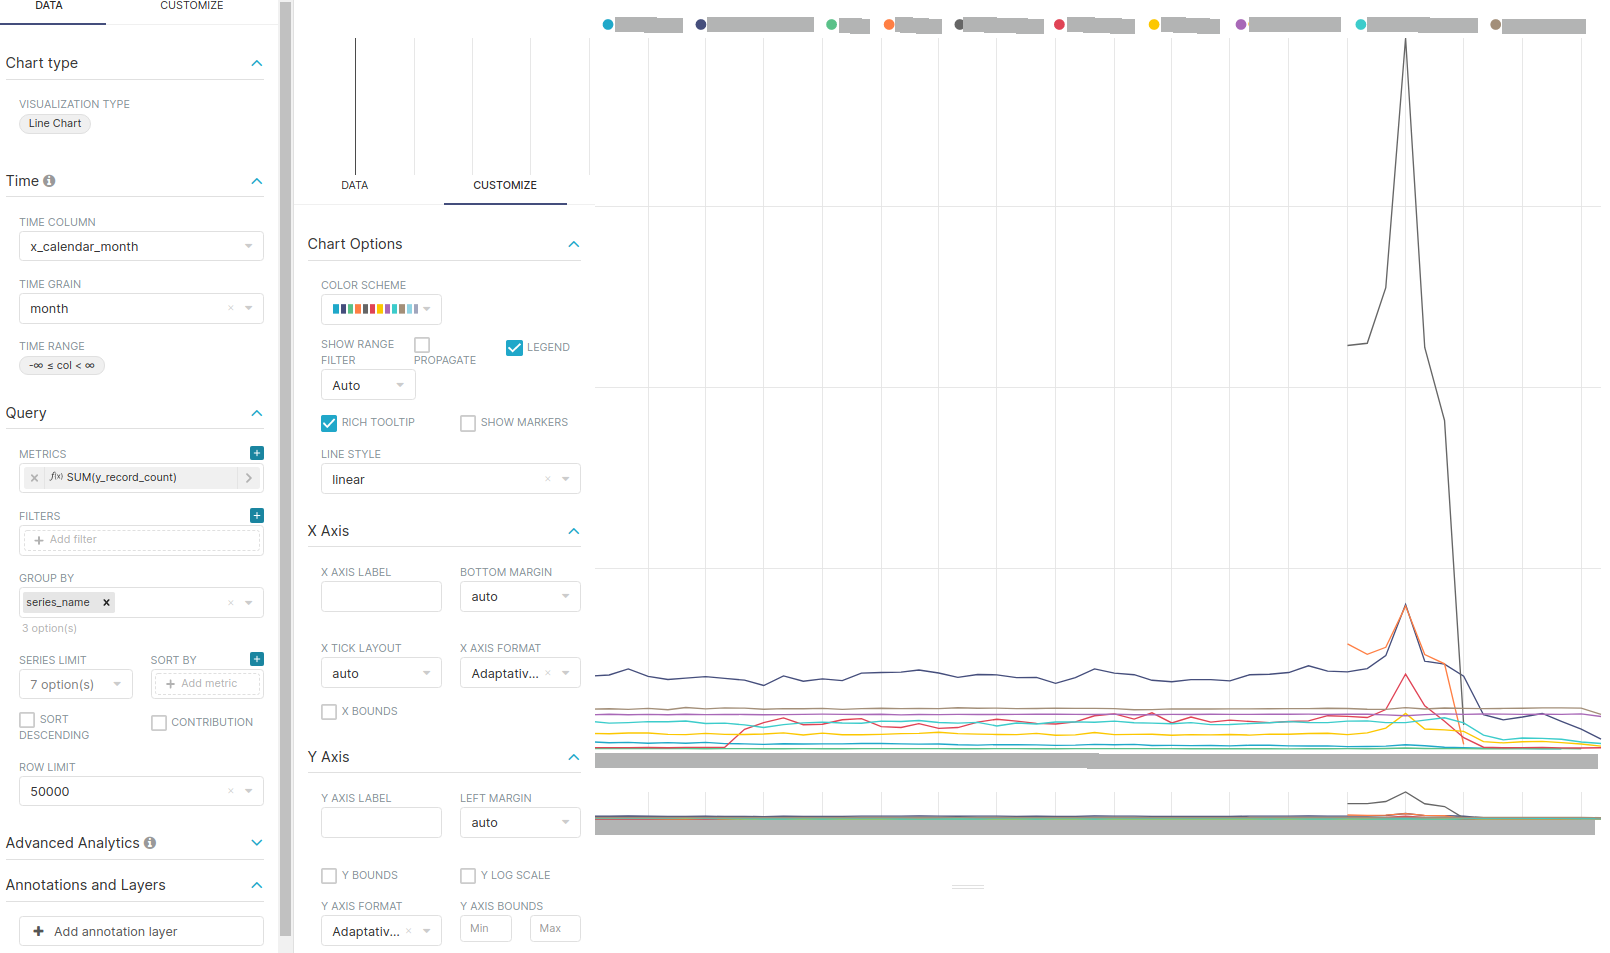
Cumulative Observation Period
Remove legend.
- Customize Tab
- Chart Options
- Legend: off
- Chart Options
Number of Observation Periods
No changes
Visit Tab
Visit Type Graph
Remove legend.
- Customize Tab
- Chart Options
- Legend: off
- Chart Options
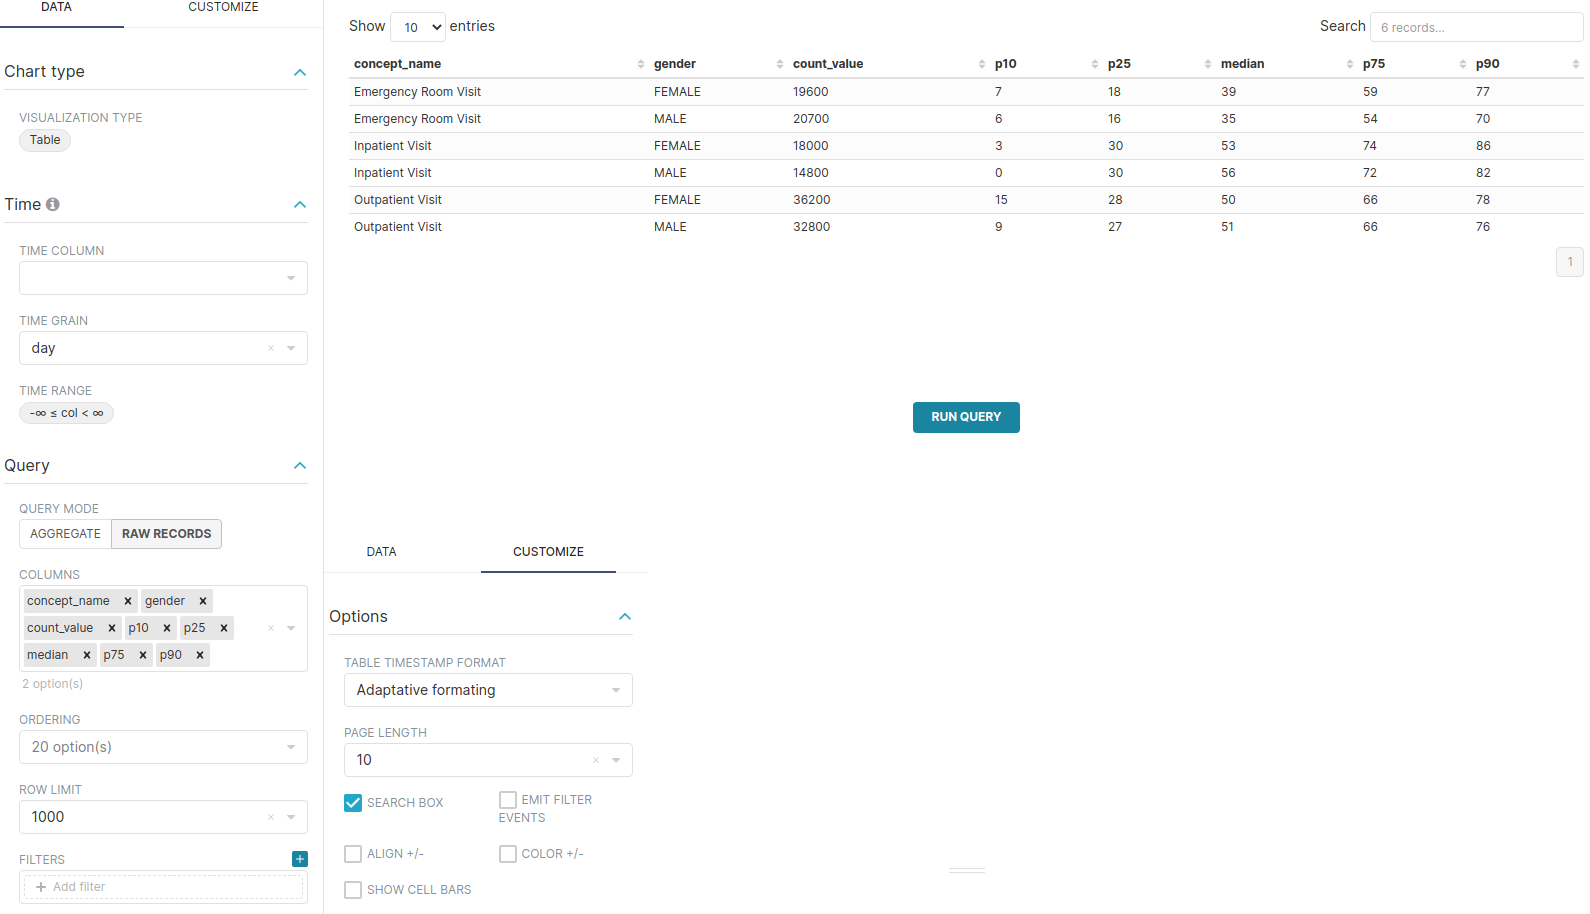
Visit Type Table
Remove the name field from the columns to display.
- Data Tab
- Query
- Columns: visit_type, num_persons, percent_persons with label persons (%), records_per_person
- Query
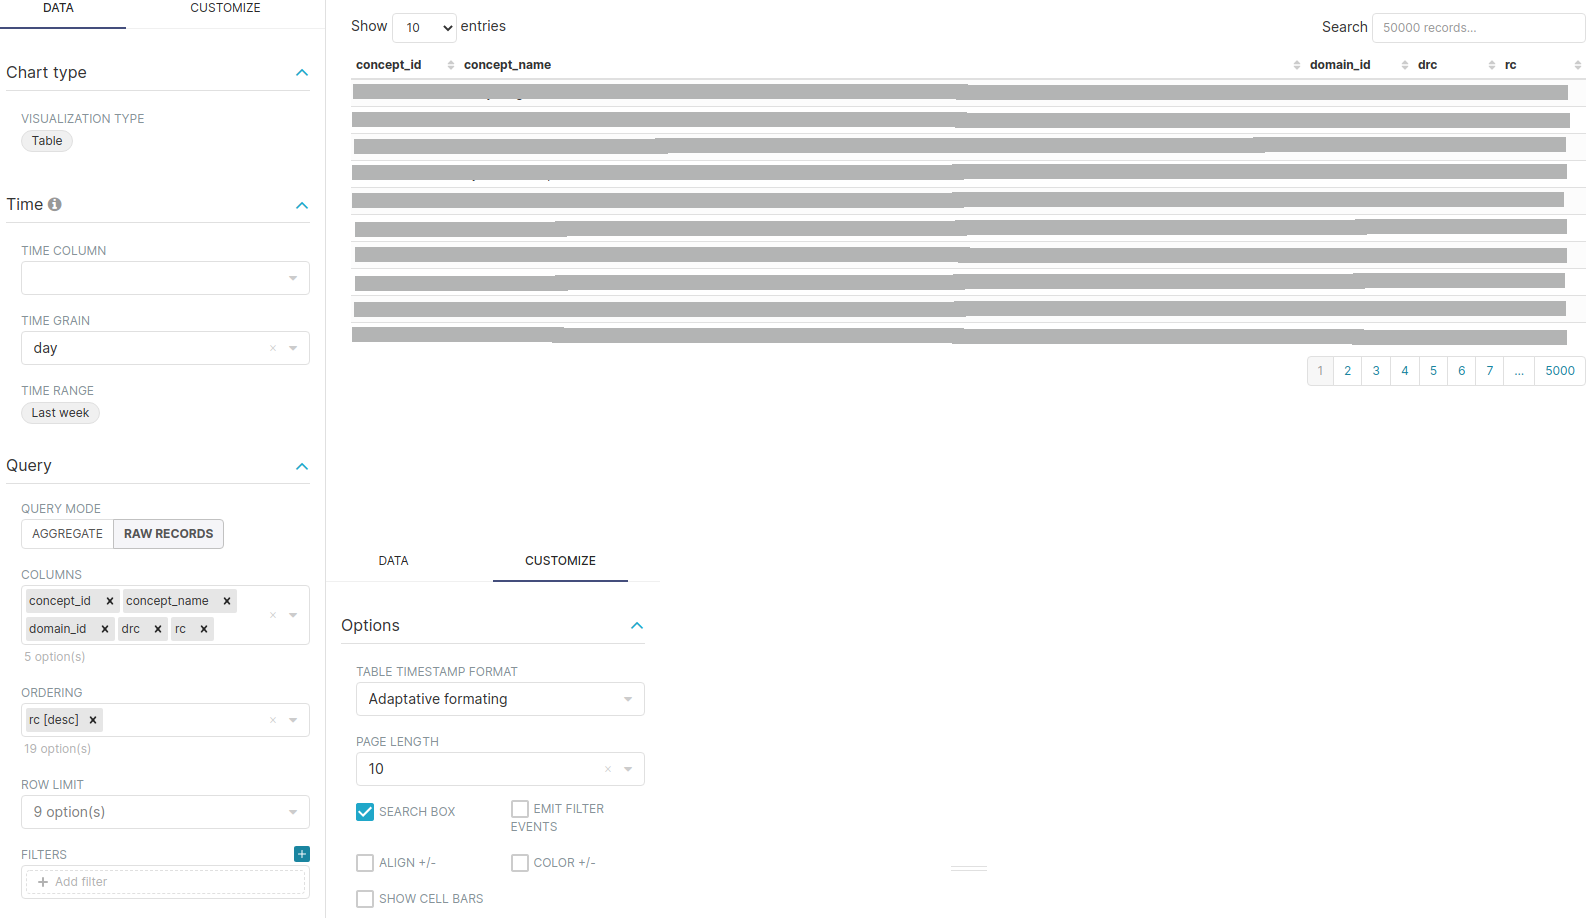
Concept Browser Tab
Domain Filter
No changes